
If you look at a chart of PLTR stock, you can see that it has had quite a ride, from its short-lived period of glory in 2021, when the stock price rallied from $10 to $45, to a slow decline to a low of $5.84.
Since April 2023, the stock has shown signs of life, with trading volume picking up and the stock price gradually rising. The main reason for this could be its involvement in the AI space. But PLTR’s stock price also hit some headwinds when analysts became concerned about the slowing in growth from US government contracts.
Impressive Earnings Send PLTR Stock Higher
Palantir’s Q4 earnings report, released Monday after the close, may be the catalyst for returning the stock to its previous highs. A large percentage of Palantir’s growth came from commercial deals. Alex Karp, CEO of Palantir Technologies, emphasized the extraordinary performance of commercial deals—70% year-over-year growth—during the Q4 earnings call. Guidance was also positive.
On Tuesday, the stock experienced its best one-day gain ever, and it has continued to rise from there. Palantir was filtered in the New 52-week Highs scan in StockCharts. The weekly chart of PLTR paints a good picture of the stock price since its IPO in 2022. The stock has moved beyond its November high of $21.85 and faces little resistance before its September and November 2021 highs.
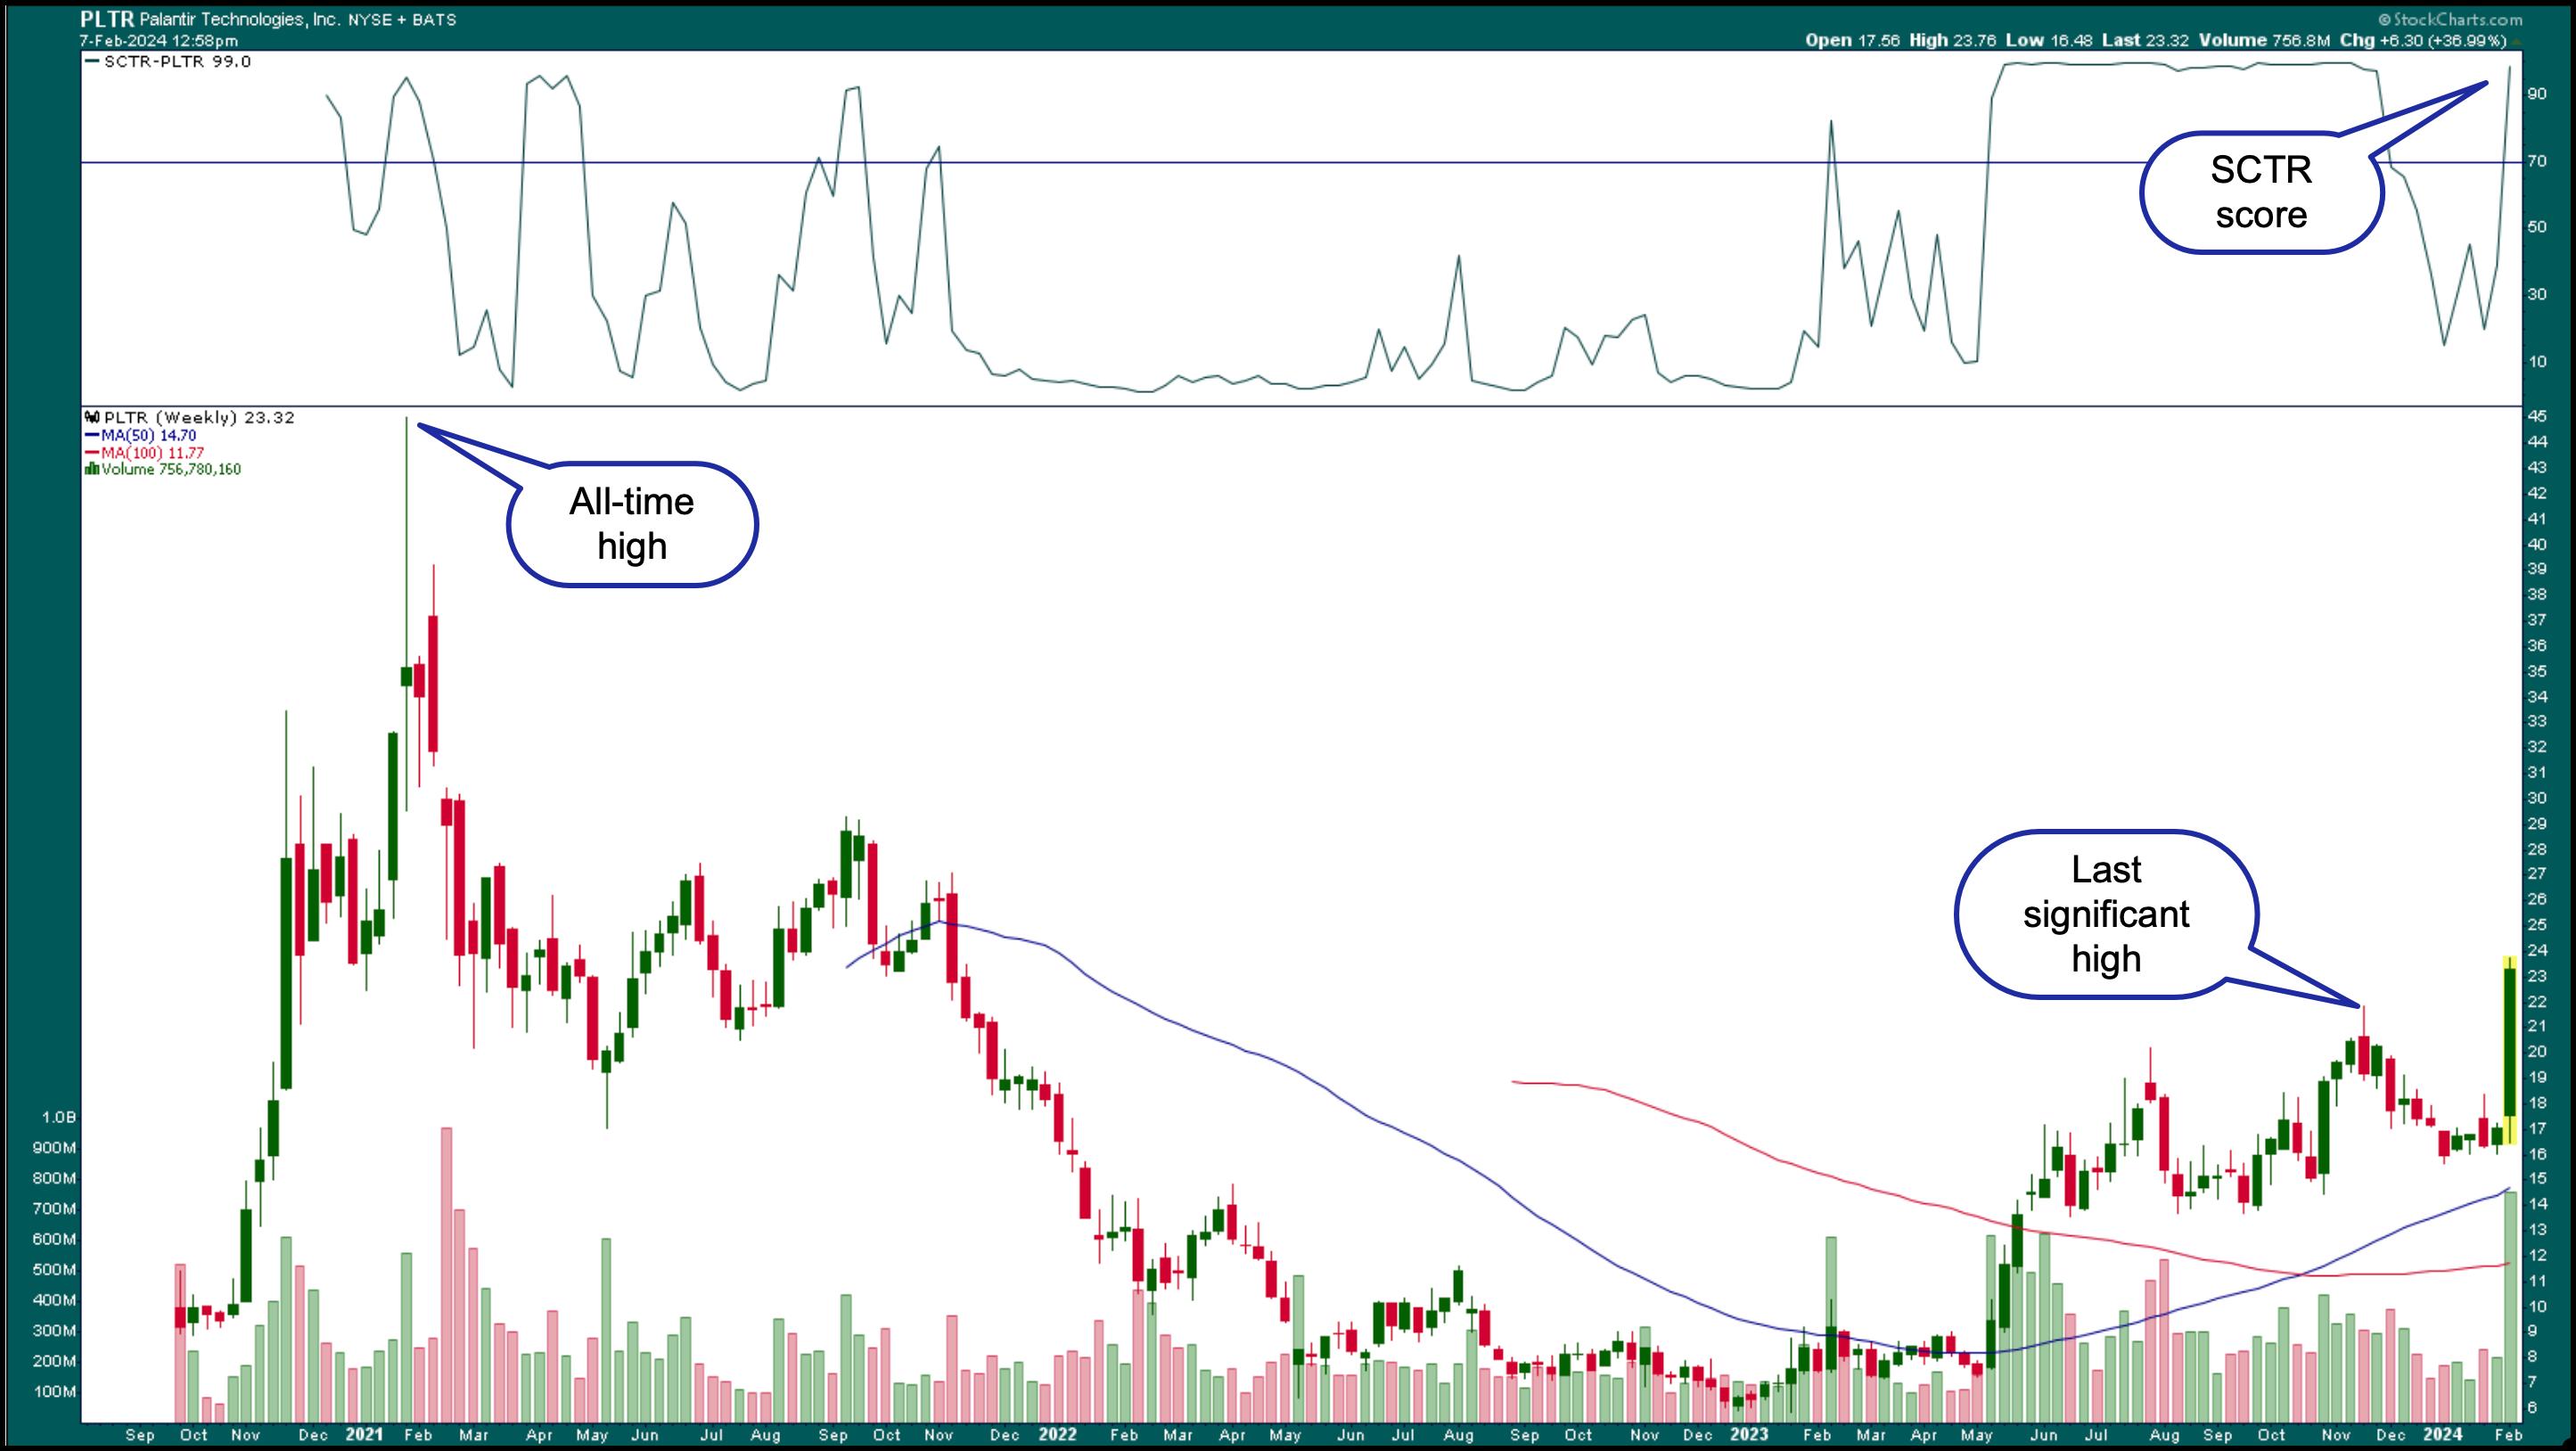
CHART 1. WEEKLY CHART OF PLTR STOCK. The stock has broken above its last significant high and has little resistance before hitting its September and November 2021 highs. The SCTR score sits at 99.Chart source: StockCharts.com. For educational purposes.
Also, note the StockCharts Technical Rank (SCTR) score of 99 (see top panel). Between May and November 2023, the SCTR score was around 99, but it dipped from there. It’s now back at its highs, which makes it a stock worth following.
Analyzing PLTR, Technically
When a stock gaps up after an earnings report, how do you know if it’ll continue to trend? One way to help identify a trend is to add an indicator, such as the Average Directional Index (ADX), to a chart (see top panel).
In the daily chart of PLTR stock below, the ADX is at 17.62, below the 20 threshold most analysts use. Note that Welles Wilder, the creator of the indicator, preferred to use 25 as the threshold level. Whichever level you use, once the ADX crosses above the threshold level, it indicates a trend.
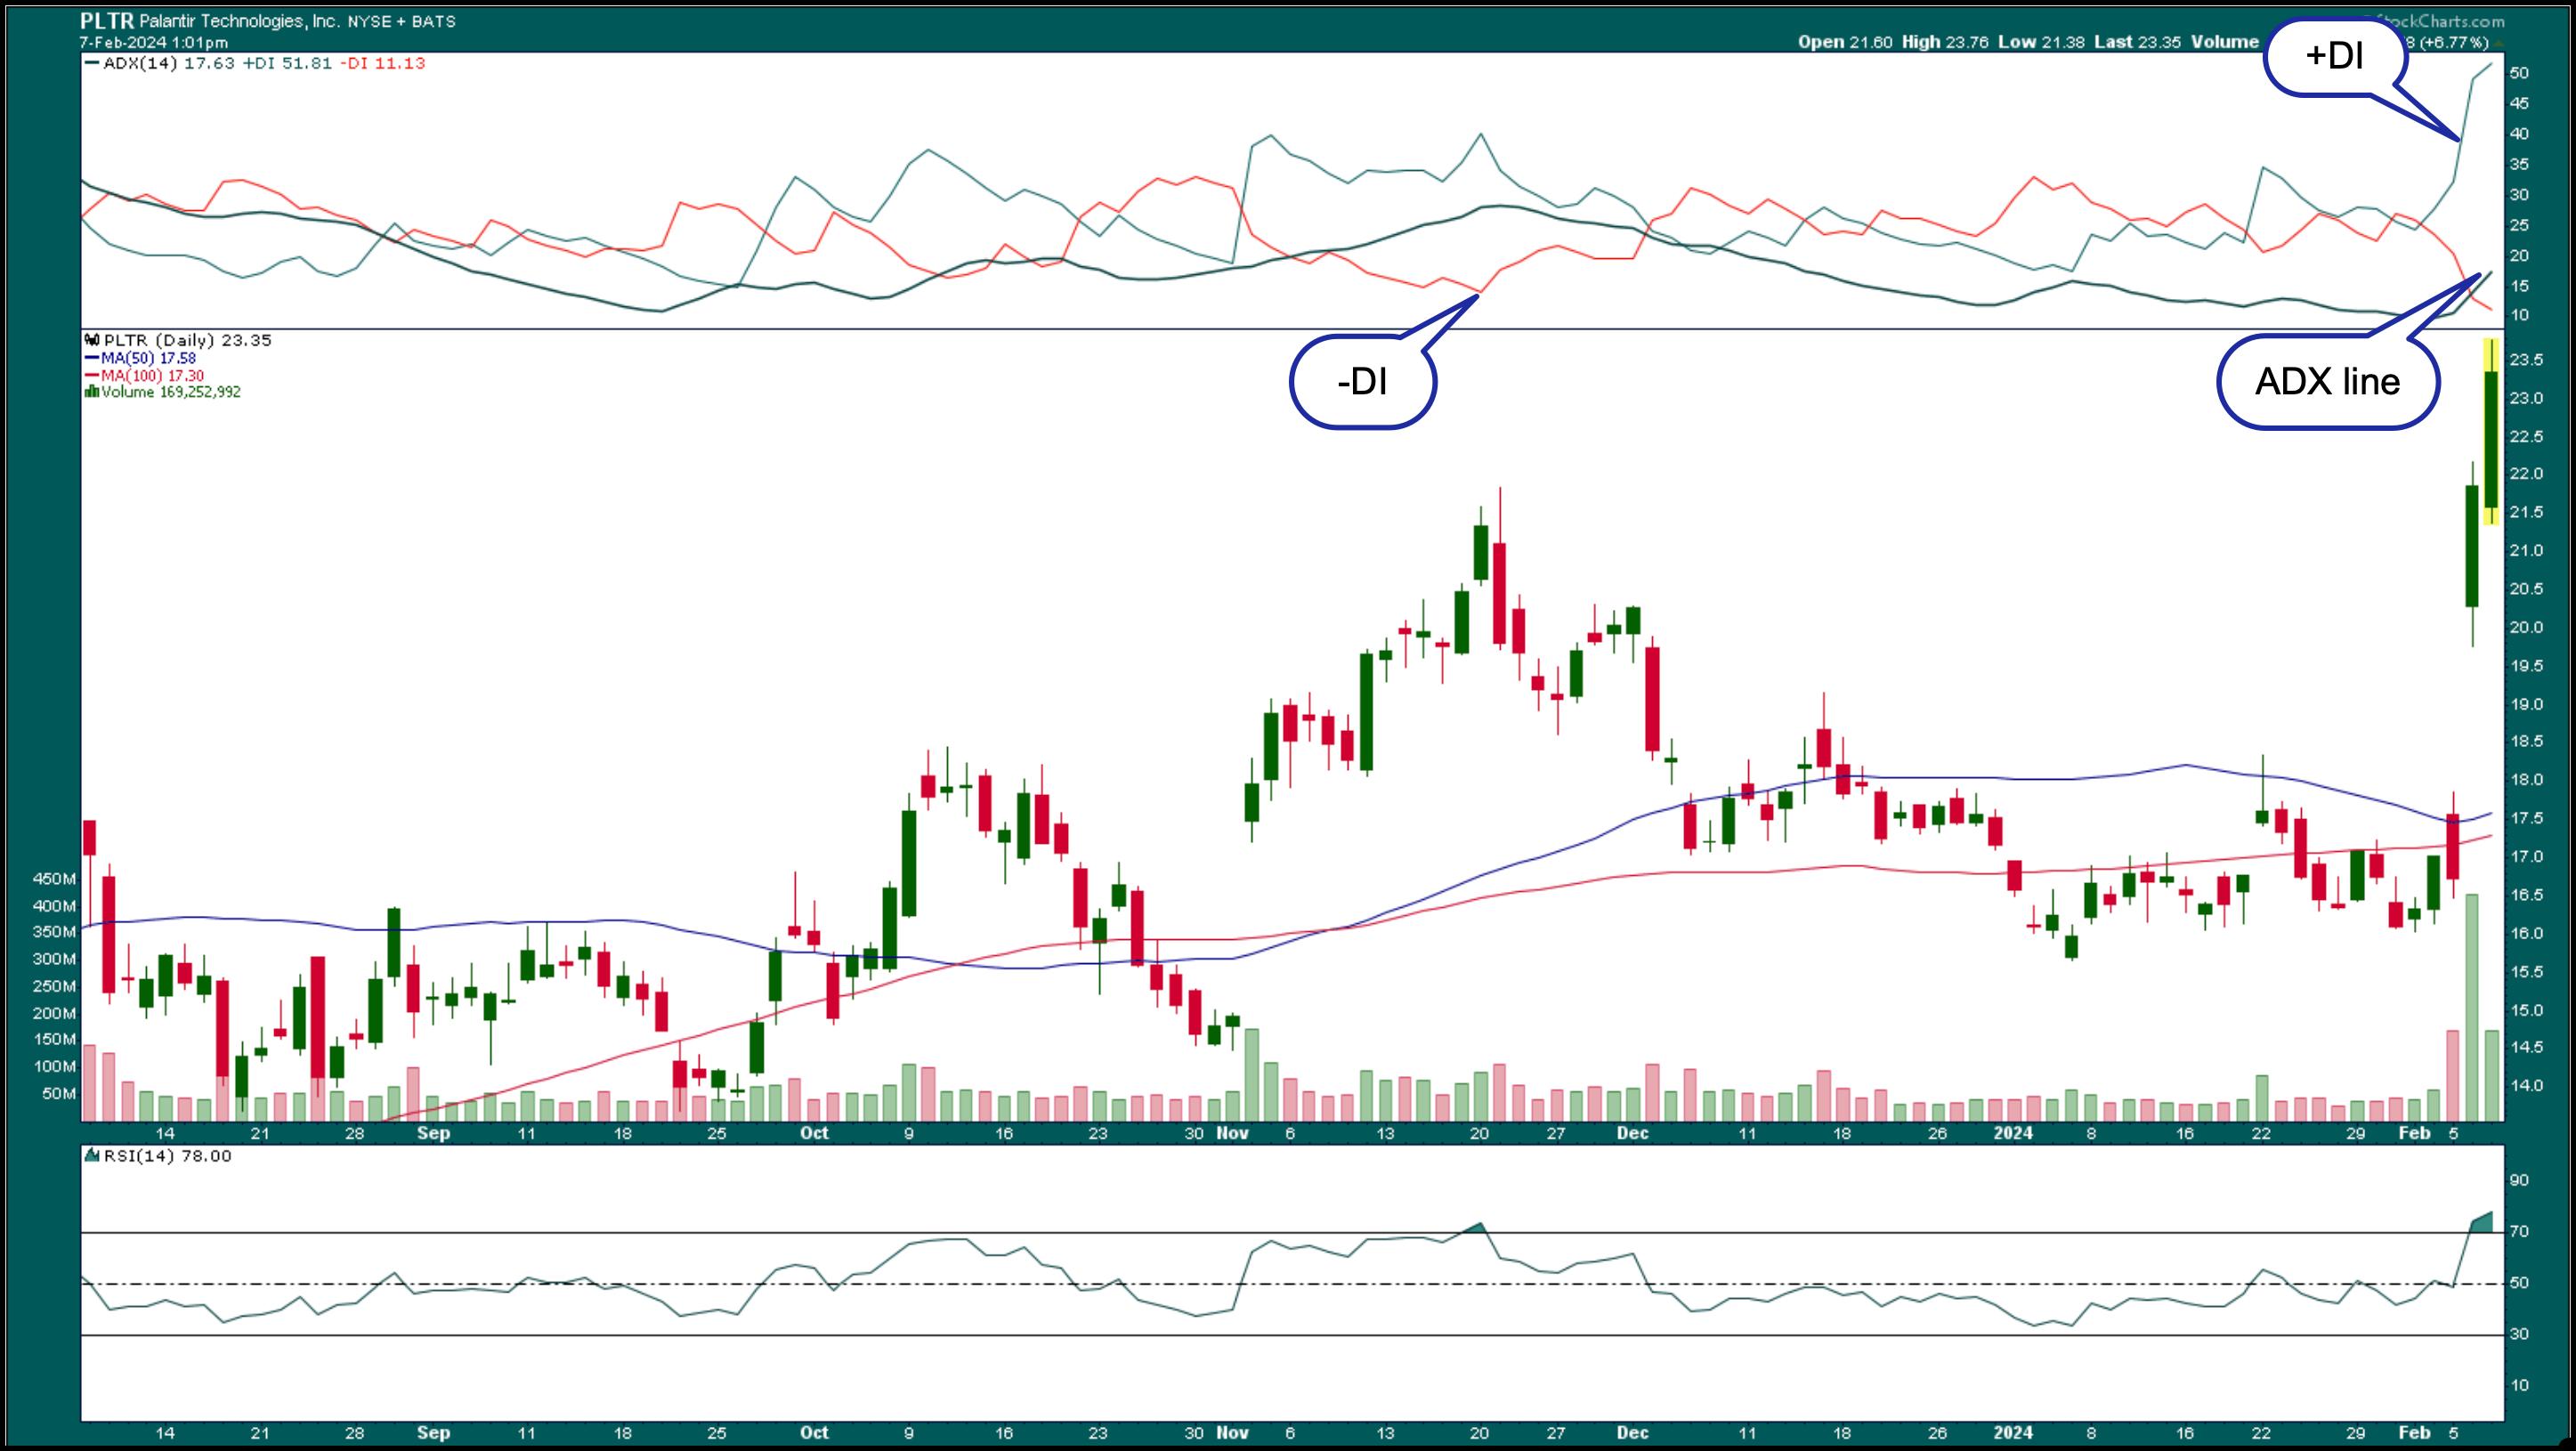
CHART 2. DAILY CHART OF PLTR STOCK. Is the gap up in the stock’s price the start of a trend? Monitor the ADX and relative strength index (RSI) to see if the momentum remains strong. If it does, the stock would be a worthwhile investment.Chart source: StockCharts.com. For educational purposes.
Since the ADX is trending higher, it may not be long before it hits the 20 level, especially if PLTR’s stock price keeps rising. Remember that the momentum may be strong, as earnings results are still fresh in investors’ minds. It tends to wane over time.
To see other stocks filtered in the StockCharts 52-week High scan, check out the Sample Scan Library page.
In addition to the ADX line, you could add the +DI and -DI lines to the indicator (select ADX Line (w/ +DI and -DI from the indicators list in the SharpCharts workbench). In the daily chart above, the +DI (green line) crossed above the -DI, which is considered a buy signal. This occurred a couple of days before the earnings report. If the +DI remains above -DI when the ADX line crosses above 20, it would be a favorable entry condition. A sell signal would be triggered when the -DI line crosses above the +DI line. You may also want to add a trailing stop if PLTR stock moves higher.

The relative strength index (RSI) is an indicator that can help identify a stock’s momentum. The RSI is in overbought territory, but that doesn’t necessarily mean the stock will sell off. A stock can remain in overbought territory for an extended period. If the stock continues to trend higher and its RSI remains overbought, it indicates that the momentum is still strong and investors are still interested in buying the stock.
The Bottom Line
PLTR’s investment in AI data analytics, upbeat earnings, and positive guidance make it a stock to consider adding to your portfolio. Another positive for the company is its four consecutive quarters of positive GAAP earnings. This makes PLTR eligible to be added to the S&P 500. If this happens in 2024, it could be another catalyst that pushes the stock price higher. Most importantly, the stock trades below $30, making it an affordable AI play for many investors.
Disclaimer: This blog is for educational purposes only and should not be construed as financial advice. The ideas and strategies should never be used without first assessing your own personal and financial situation, or without consulting a financial professional.


