
Costco (COST) stock has soared into uncharted heights, leaving its last all-time record in the dust. With a little under a month before the company is scheduled to open its earnings book, you’d think investors are expecting something of a blowout report, judging from the price action.
Costco Outperforming the Broader Market and the Staples Sector
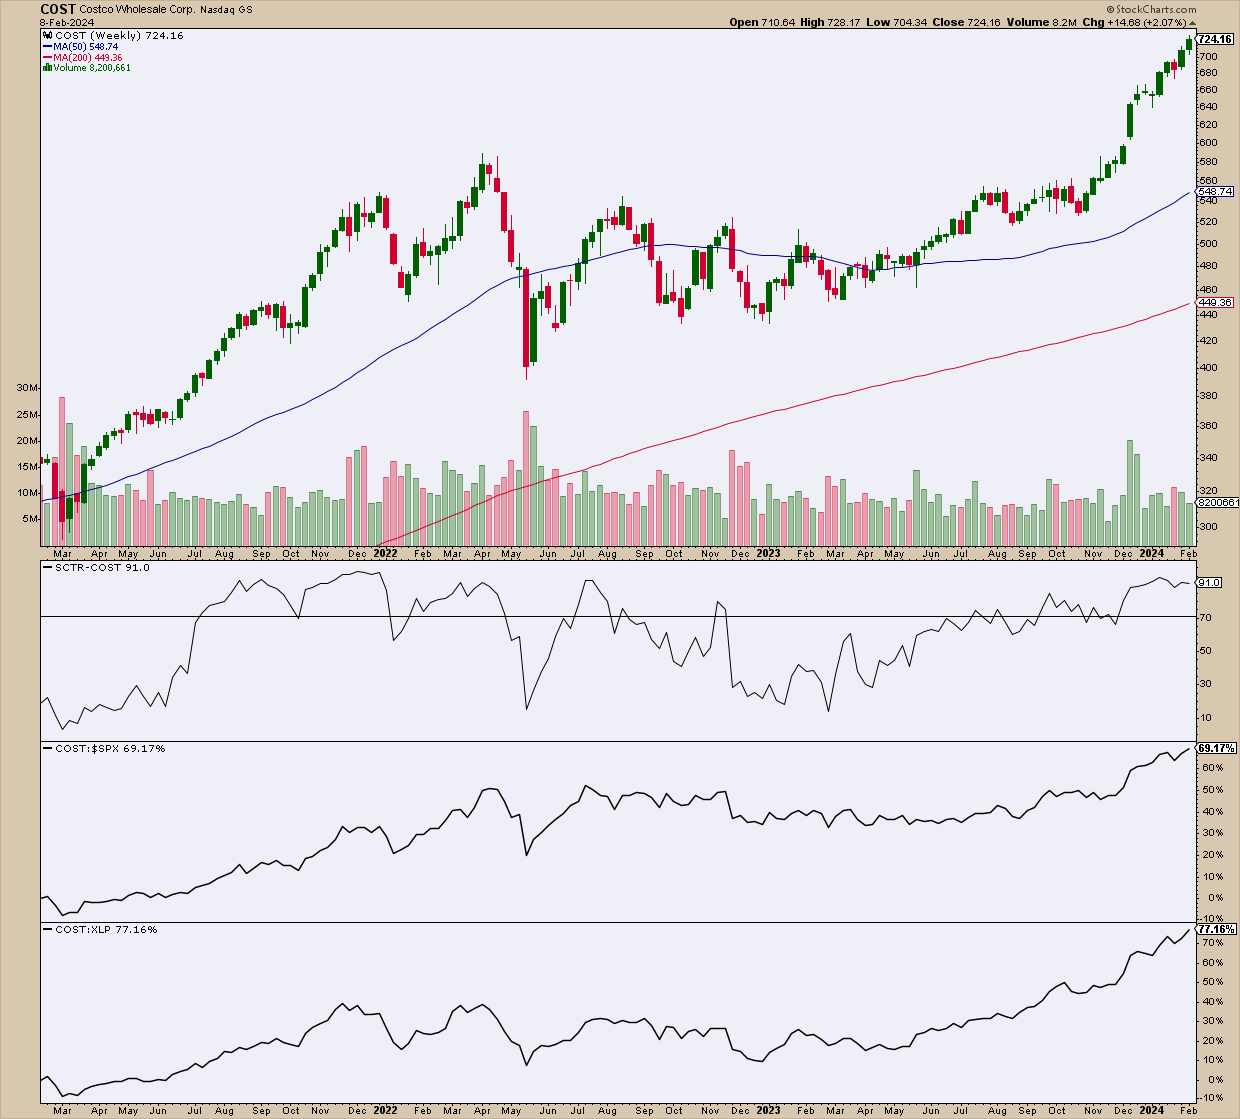
CHART 1. WEEKLY CHART OF COST. Note COST’s strong outperformance in technical ranking and relative to a few key benchmarks.Chart source: StockCharts.com. For educational purposes.
Costco’s SCTR score crept up to 91, which it hasn’t seen since 2022, when it last broke record-high territory. This indicates that several technical indicators are flashing a bullish signal, supported by the “full sail” position of its 50-week and 200-week simple moving average (SMA). Strong bullish momentum? It sure appears so.
Plus, COST, on a longer-term scale, has outperformed the broader market ($SPX) and its sector, Consumer Staples, quite handsomely, clocking in a 69% and 77% gain over those respective benchmarks. As an aside, COST is among the several large cap stocks that came up on Thursday’s New All-Time Highs scan, on a day when the big three indices barely budged.
But is there sufficient tailwind to maintain its skybound momentum? One way to gauge this is to add an indicator, such as the Money Flow Index (MFI).
Plotting the Money Flow Index on SharpCharts
To add the MFI:
- From Your Dashboard, click on Charts & Tools at the top left navigation bar;
- SharpCharts is the top left selection; enter your ticker symbol there;
- In the SharpCharts Workbench, select the Money Flow Index from the Indicators menu to view the indicator.
What’s Happening to the Tailwinds?
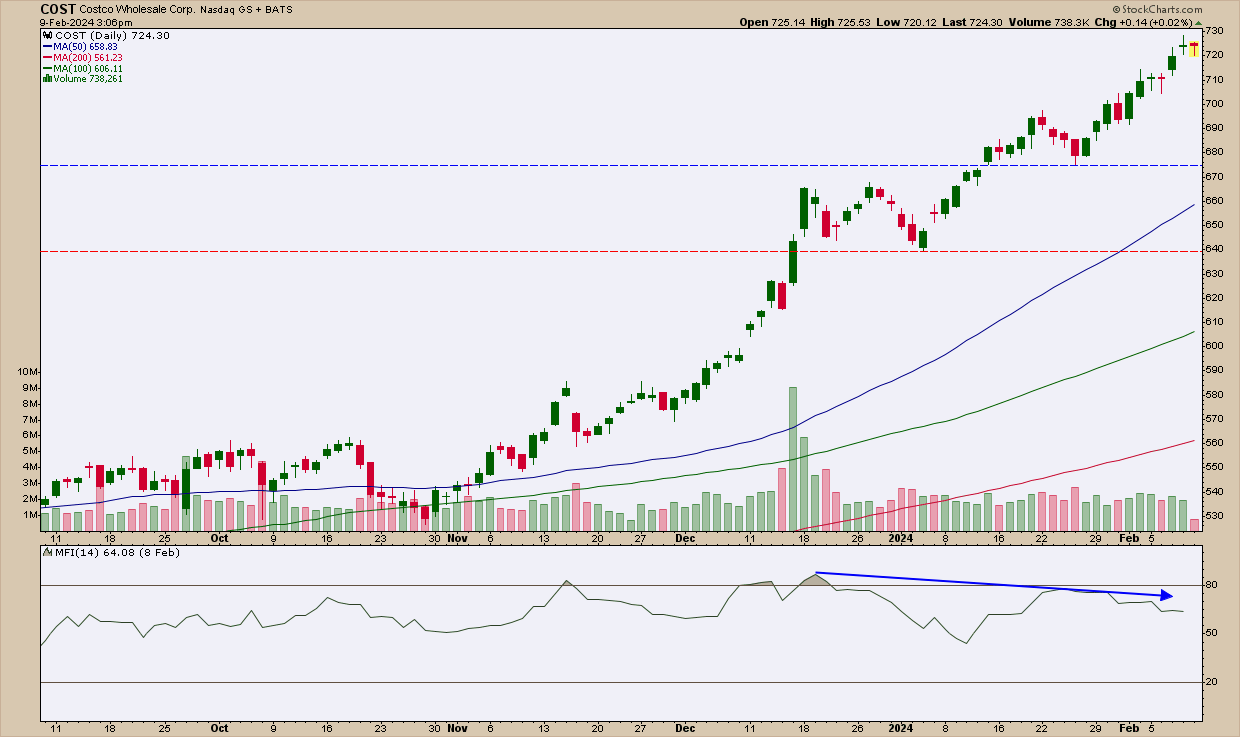
CHART 2. DAILY CHART OF COST. Note that all points to continued bullishness except for the MFI, which started showing a decline in buying pressure in December.Chart source: StockCharts.com. For educational purposes.

A quick recap: The Money Flow Index (MFI) is essentially a volume-weighted Relative Strength Index (RSI). When prices go up, more money flows in (buying pressure), and when prices go down, money flows out (selling pressure). The MFI is a momentum oscillator that uses volume and price movements to spot potential turning points and extreme price levels.
You can see COST rising steadily with a slight pullback. Meanwhile, the 50-day, 100-day, and 200-day SMAs are fully extended, indicating a strong uptrend.
In contrast, however, the MFI is declining (see blue arrow) from its last “overbought” level in mid-December, as price continued to rise. This divergence indicates that prices are going up, despite buying pressure declining. In short, a pullback is due, and the most recent candle hints that the market may also be getting the message.
Still, it’s too early to confirm that this is the start of a pullback. Typically, Fibonacci retracement levels would be helpful in measuring the pullback and determining a few good long entry points, but this isn’t possible just yet, as the pullback hasn’t been confirmed.
So instead, if you’re bullish on COST, set a price alert at $675, its last swing low (see blue horizontal line). A break below this level would likely mean prices are heading further down. And from there, you’ll have several potential entry points:
- A pullback confirmed would be the green light to use StockCharts’ Fib retracement tool, which can be used to identify an entry point;
- Look at the 50-day or 100-day SMAs for a potential bounce (especially if any enter confluence with other market support levels); and/or
- Set your sights at $640 (see red horizontal line), the next swing low, for a potential entry.
The Bottom Line
The StockCharts’ New All-Time High scan engine, coupled with the SCTR ranking, is a valuable tool for identifying strong stocks to trade. Of course, “all-time high” can often mean “too high” or overbought. Indicators like the MFI, among others, can help you understand whether there’s enough momentum to support the stock’s current trajectory or if it’s due for a pullback. Oftentimes, stocks hitting a record high are due for a pullback, and that’s where you select the technical tools to measure the pullback and identify potential entry points.
Disclaimer: This blog is for educational purposes only and should not be construed as financial advice. The ideas and strategies should never be used without first assessing your own personal and financial situation, or without consulting a financial professional.


