Earnings and interest rates are always the key drivers to stock market success. There may be other short-term factors that influence price action, but, at the end of the day, rising earnings and interest rates conducive to job and economic growth is what results in secular bull markets.
Organize Your Trading Candidates With ChartLists
While I follow interest rates very closely and consider them when evaluating likely future market direction, it’s really the earnings reports that we follow most closely at EarningsBeats.com. Q4 earnings are not yet complete, but most of the very influential companies in the Dow Jones, S&P 500, and NASDAQ have reported. Our research, including earnings research, is organized into many ChartLists, which I briefly describe below:
- Strong Earnings (SECL): companies beating both revenue and EPS estimates and meeting other liquidity and performance filters. I view it as a list of companies demonstrating high quality technicals and fundamentals. It’s the ChartList that I trade from most frequently.
- Strong Future Earnings (SFECL): companies that show excellent relative strength (high SCTR scores) and adequate liquidity that are not already on the SECL. I think of it as a list of excellent companies that simply weren’t able to beat estimates in their prior quarter, but who are trading as though they may do so in the quarter ahead.
- Strong AD (SADCL): companies showing excellent relative strength (high SCTR scores), adequate liquidity, and rising AD (accumulation/distribution, not advance/decline) lines. The AD lines IGNORES opening gaps and focuses only on price action during the day, with volume being the multiplier. Companies on this ChartList are companies that tend to trade higher into the close, suggesting morning weakness might be bought.
- Raised Guidance (RGCL): companies that, as the name would suggest, raise guidance – either revenues, EPS, or both. I like management teams that feel confident in their business and raise guidance throughout the quarter.
- Bullish Trifecta (BTCL): companies that are common to the SECL, SADCL, and RGCL. These companies have produced strong quarterly results, have raised guidance, and show possible accumulation by big Wall Street firms.
- Earnings AD (EADCL): companies that gain AT LEAST 5% from the opening bell to the closing bell on the day after earnings are reported. I then review every one of these companies and provide my Top 30 – companies that I really want to consider trading in the days and weeks ahead.
- Short Squeeze (SSCL): companies whose float is heavily shorted. We track those companies with short percentage of float in excess of 20%. High short interest can trigger massive short squeeze rallies.
- Seasonality (SEASCL): companies that have a history of performing well during certain calendar months.
- Portfolio ChartLists: every quarter, we provide a list of companies that we “draft” into our 4 portfolios – Model Portfolio, Aggressive Portfolio, Income Portfolio, and Model ETF Portfolio.
- Relative Strength Industry Groups (RSICL): This is an exclusive ChartList for our annual members that tracks the relative strength of every industry group over the past few years. Trading leading stocks in leading industry groups is how you beat the S&P 500 and this ChartList provides us those leading industry groups.
There are other ChartLists that we create from time to time, but you can see from the above that our research is broad and provides a TON of great information for our members on a regular basis. But before trading anything, it makes sense to evaluate the current state of the market. Is the current rally sustainable?
S&P 500: Is the Current Rally Sustainable?
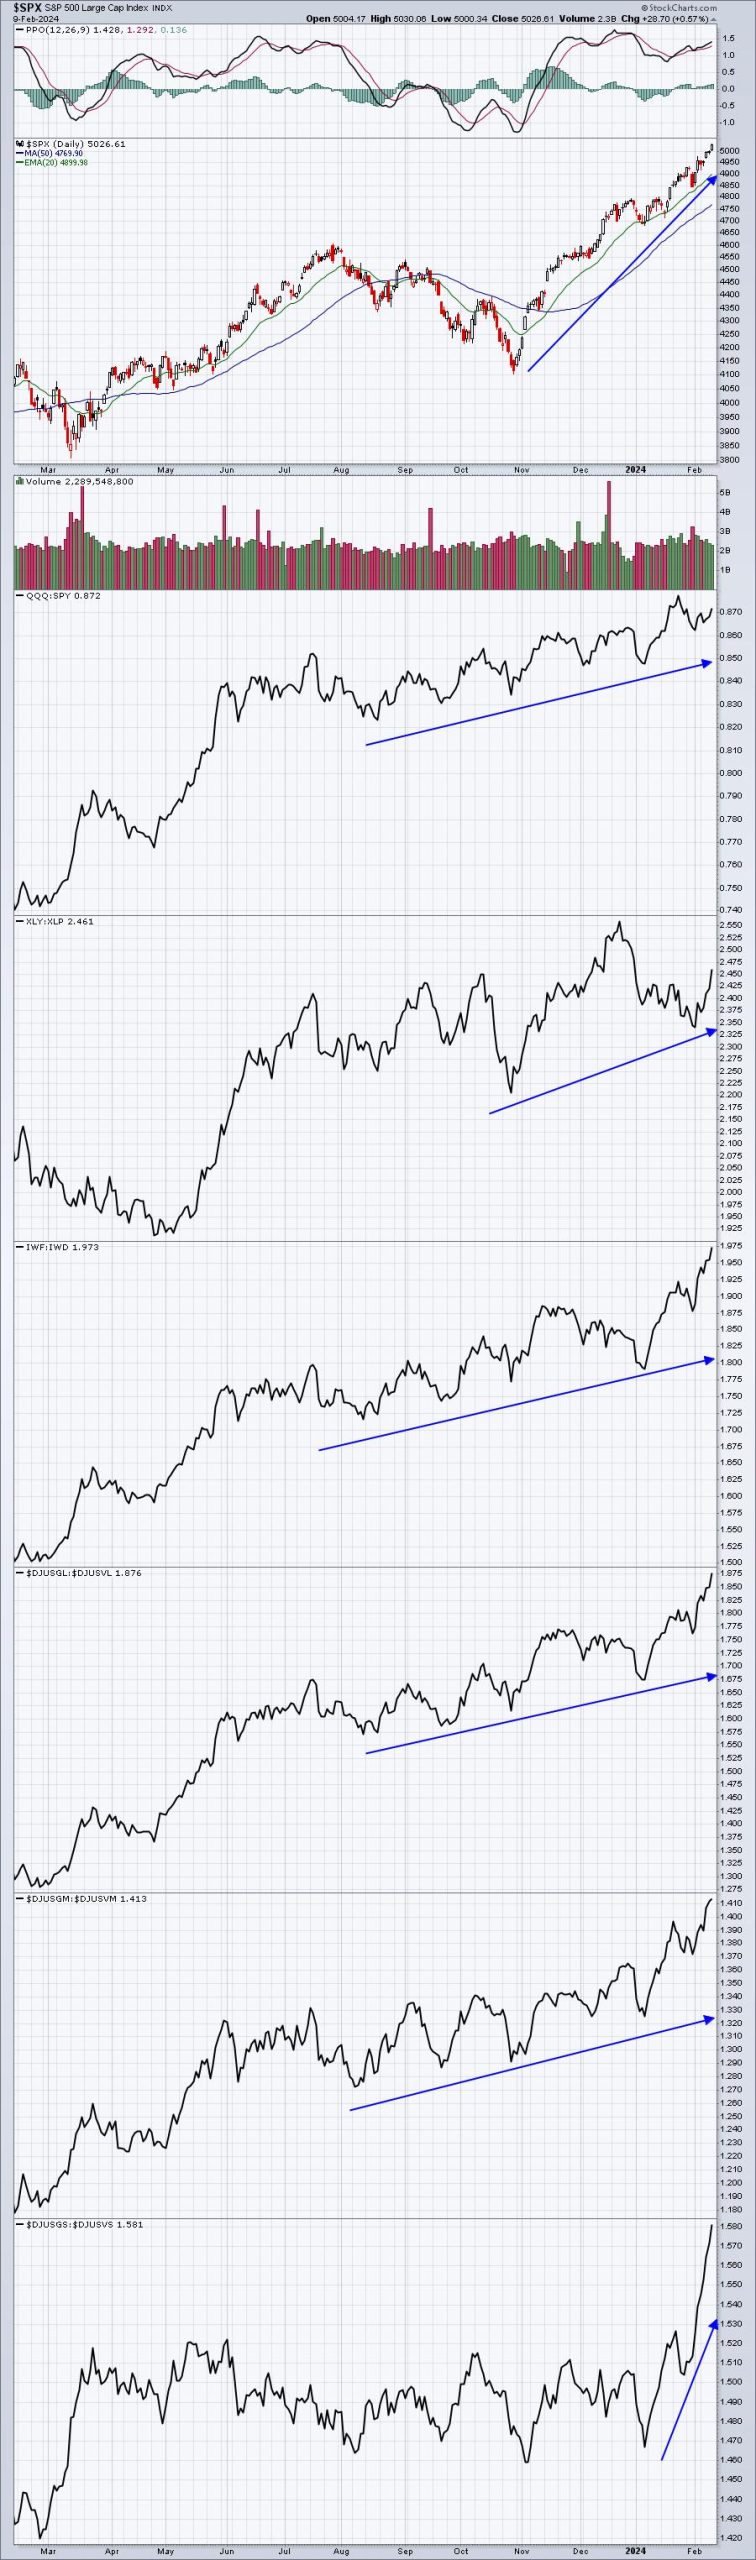
I say yes. Sure, we’ll have some pullbacks along the way, but right now money is flowing into aggressive areas of the market and that “risk on” environment bodes well for higher prices ahead. Check out this S&P 500 chart with several key “sustainability” ratios in the panels below the S&P 500 price chart:
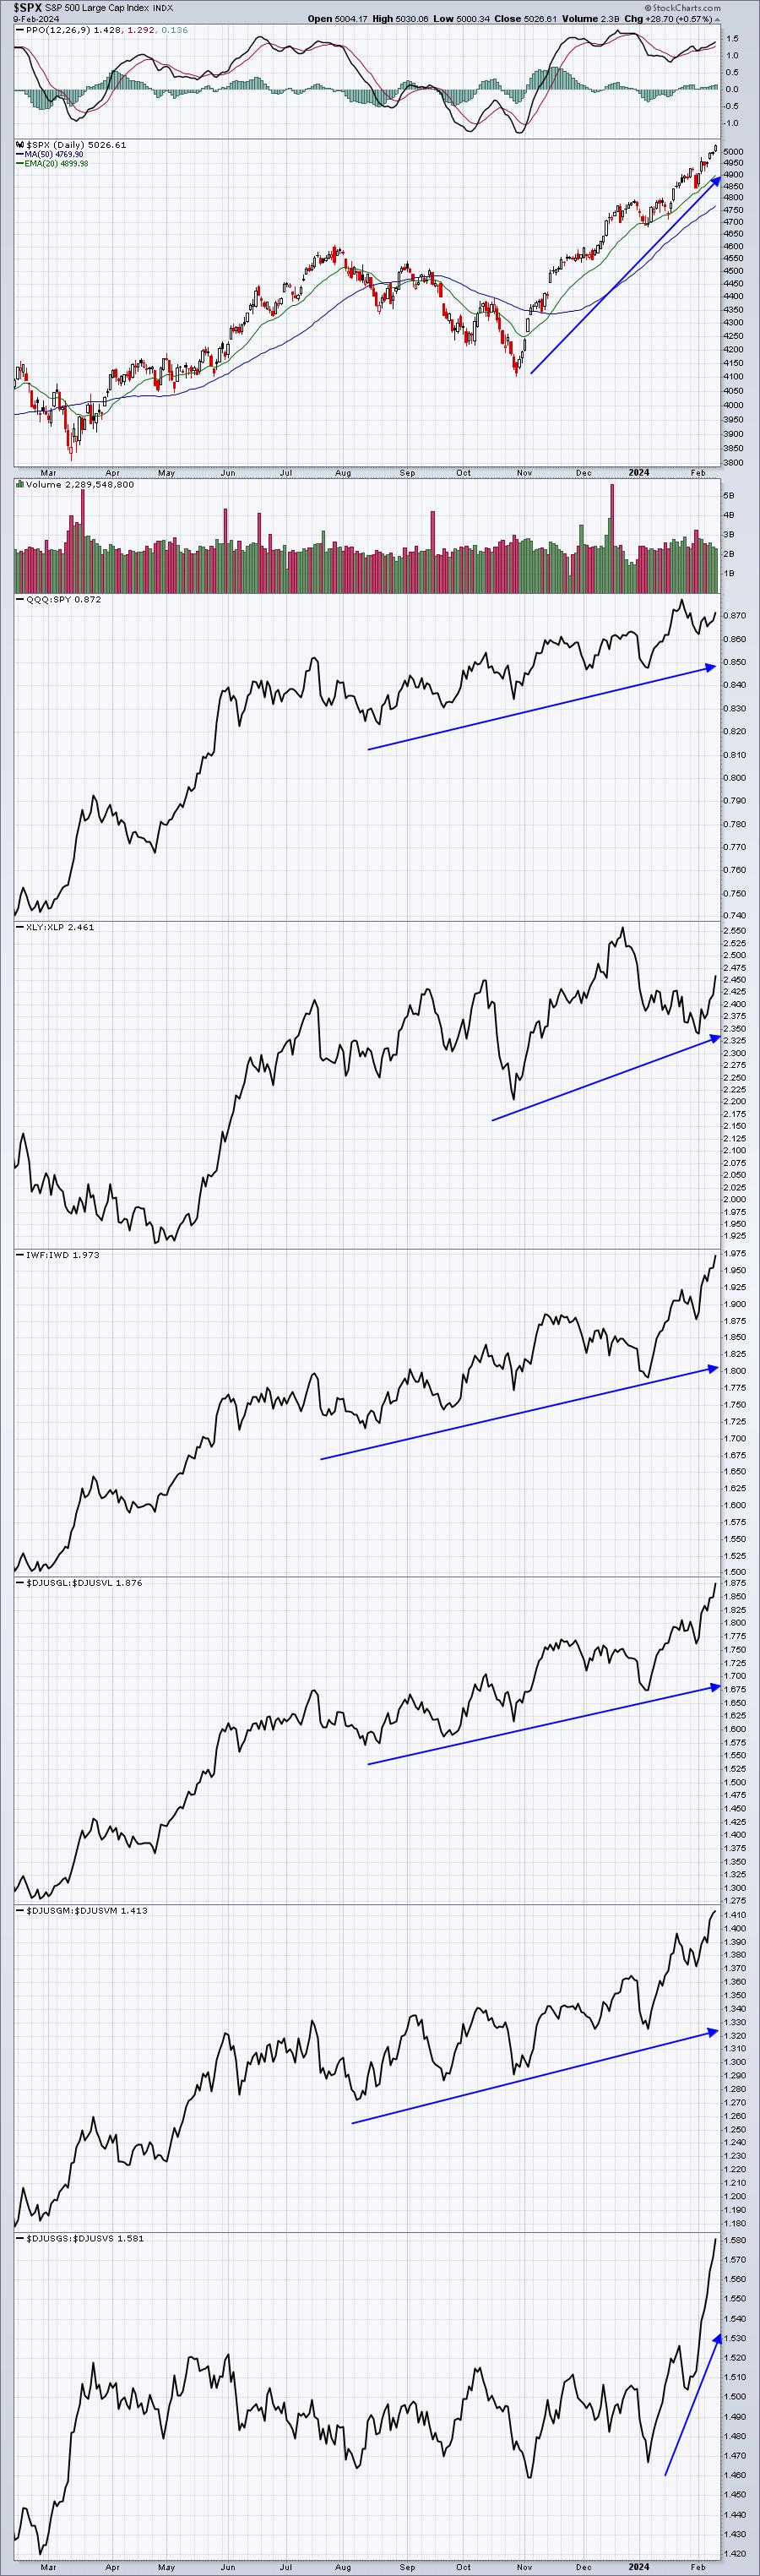
Is this not obvious? Money continues to POUR INTO aggressive areas. The 6 sustainability ratios above can be summarized as follows:
- QQQ:SPY – NASDAQ 100 performance vs. S&P 500 performance. The NASDAQ 100 is a much more aggressive index, focusing almost solely on high growth large cap stocks.
- XLY:XLP – consumer discretionary vs. consumer staples. Two-thirds of our GDP is consumer spending. It just makes sense to see which area of consumer spending, aggressive discretionary vs. defensive staples, Wall Street is favoring. That tells us what the big Wall Street firms are expecting in the months ahead.
- IWF:IWD – large cap growth vs. large cap value.
- $DJUSGL:$DJUSVL – another measure of large cap growth vs. large cap value
- $DJUSGM:$DJUSVM – mid cap growth vs. mid cap value
- $DJUSGS:$DJUSVS – small cap growth vs. small cap value
Every one of my aggressive vs. defensive ratios is climbing. Personally, I love all the pessimists out there constantly trying to tear apart this bull market. The problem is that many analysts are trying to handpick one or two SECONDARY indicators to determine market direction, which is absolutely wrong in my opinion. We remain extremely bullish if we look at the primary indicator, which is price and volume. Sentiment does a great job of marking market tops and bottoms and my favorite sentiment signal is the equity only put call ratio ($CPCE).
Sentiment Paving The Path To Higher Prices….For Now
Despite the nearly straight-up move that we’ve seen on our major indices since late-October, there is little complacency in the options world. Over the past 11 years, or approximately the duration of this entire secular bull market, the average daily CPCE reading has been in the .60-.65 range. Readings higher than this show an unusually heavy dose of equity put buyers (which coincides with market bottoms or approaching market bottoms), while lower readings suggest an unusually heavy dose of equity call buyers (which coincides with market tops or approaching market tops). While action has been mostly bullish in 2024, the average CPCE reading in 2024 has been .65 – a far cry from the 5-day average readings of .55 and below that typically mark market tops. Check this out:
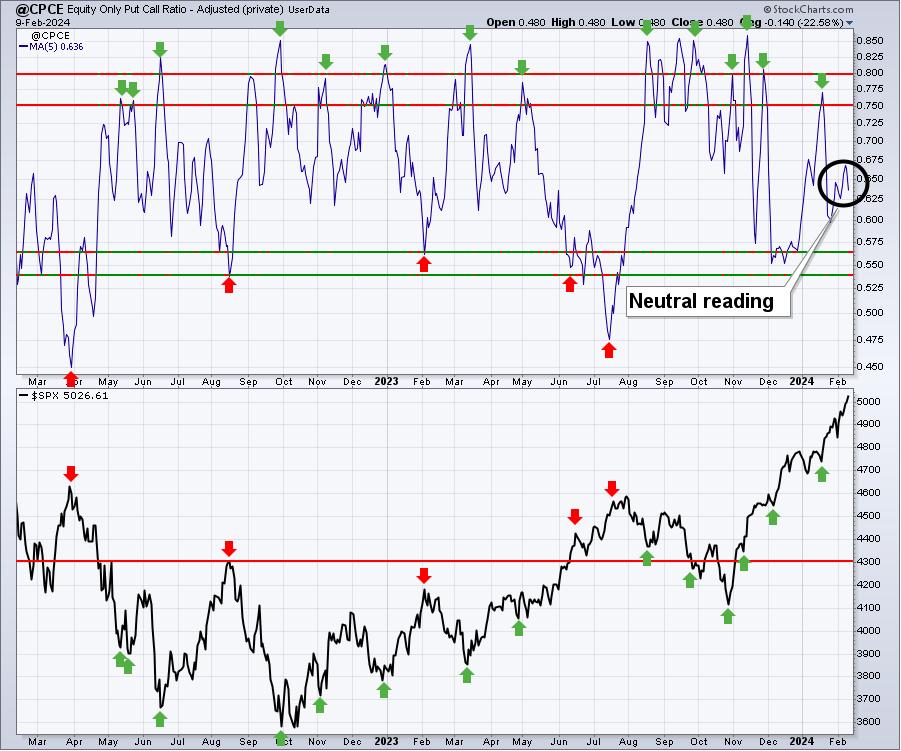
Those red arrows highlight the very low 5-day CPCE readings and show you where the S&P 500 was at roughly the same time. After reviewing this chart, I’d quickly conclude that this rally may continue until we see options traders start pouring into equity calls. Friday’s CPCE reading was 0.48. If the S&P 500 continues higher through much of next week, it’s possible we could finally get a 5-day CPCE reading below .55 to mark a top. Friday’s 0.48 reading was a good start. Keep an eye on this throughout next week.
What Stocks Are Likely To Lead The Next Market Surge
Well, I believe our Earnings AD ChartList (EADCL) will hold the key. Again, this ChartList comprises 30 names that performed exceptionally well the day after its earnings were released as new fundamental information started to be priced in. I expect many of them to perform very well in the weeks ahead. Most of the companies on this ChartList are leaders among their peers. But others might just be getting started. Let me give you 1 of the 30 stocks featured, and one that might fit this description of just getting started – Allegro Microsystems (ALGM), a $6.1 billion semiconductor company:
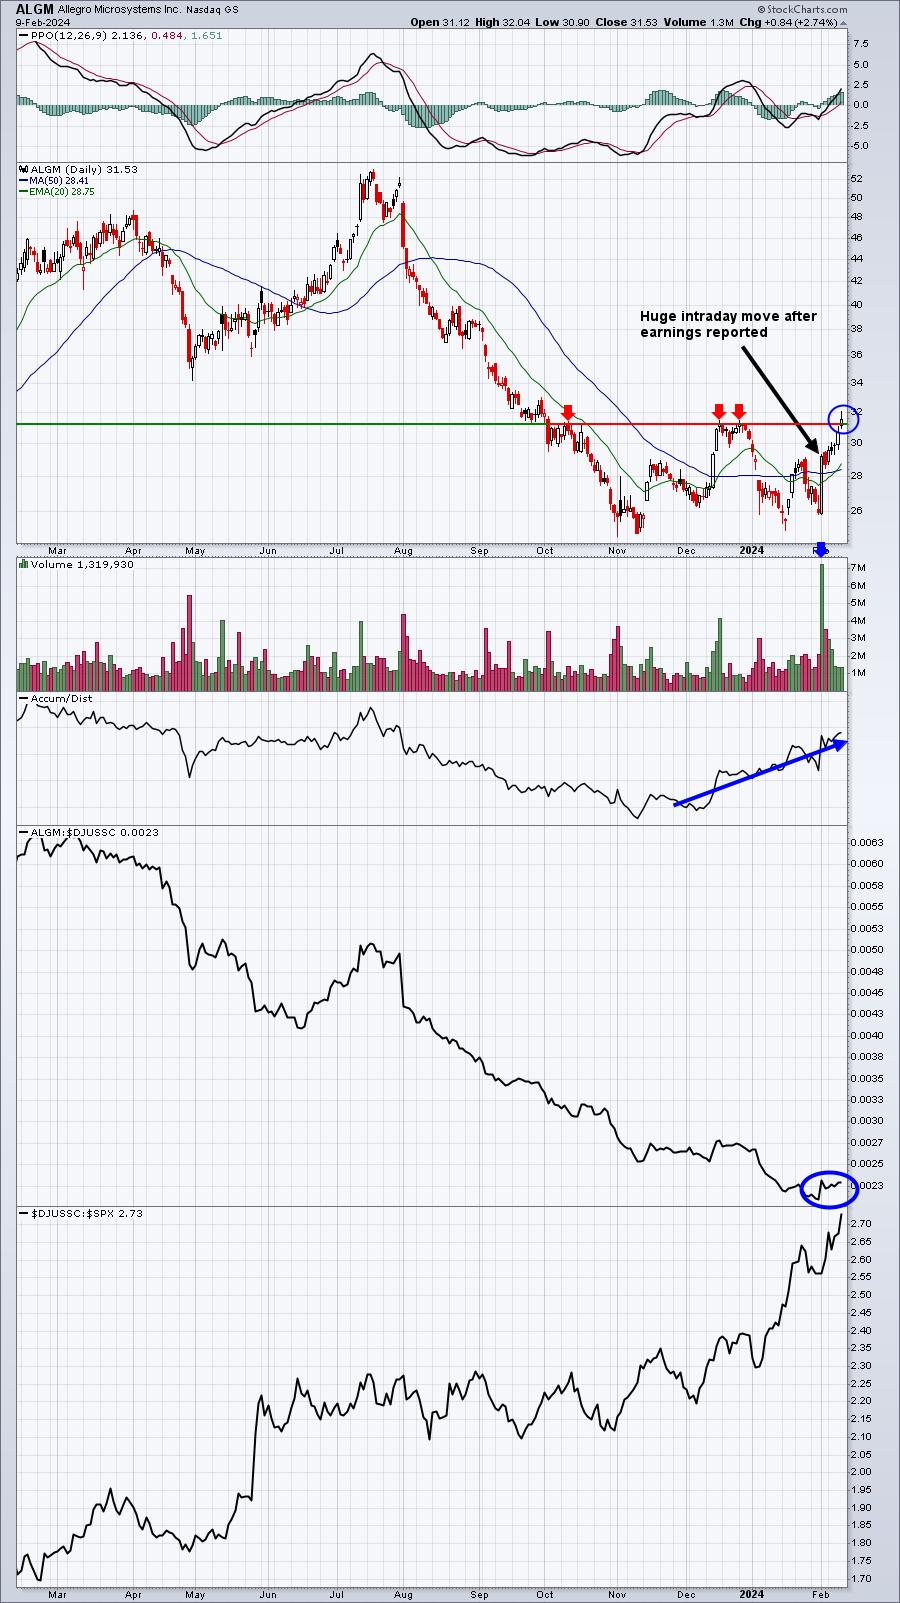
ALGM’s relative strength vs. its semiconductors peers has been awful. But is it just starting to reverse higher? The AD line began strengthening a few months ago at the initial bottom and, on Friday, ALGM finally broke above a triple top. Notice that volume that accompanied the post-earnings run. We never have any guarantees of future price direction, but I’d certainly say that ALGM has my attention and is a stock that I’ll be watching as this could be the start of a very powerful advance.
In tomorrow’s EB Digest, our FREE newsletter, I’ll be providing everyone a link to our ENTIRE Earnings AD ChartList. If you’re a StockCharts.com Extra or Pro member, you can download this ChartList right into your SC account. Otherwise, you can view all 30 charts to see which stocks could be our leaders in 2024. If you’re not already a FREE EB Digest subscriber, it’s easy to get started. Simply CLICK HERE and provide us your name and email address and we’ll be happy to send you that Earnings AD ChartList in our Monday EB Digest newsletter. There is no credit card required and you can unsubscribe at any time.
Happy trading!
Tom


