The Nasdaq 100 ETF (QQQ) is beginning to show further signs of deterioration, from bearish momentum divergences between price and RSI to weakening breadth using the Bullish Percent Index. How can we determine whether a pullback could turn into something more disastrous for stocks? Let’s look at how the 50-day moving average, Chandelier exits, and Fibonacci retracements can help anticipate downside risk for the QQQ.
To kick things off, we need to acknowledge how the QQQ has a place of distinction on the growing list of charts showing bearish momentum divergences.
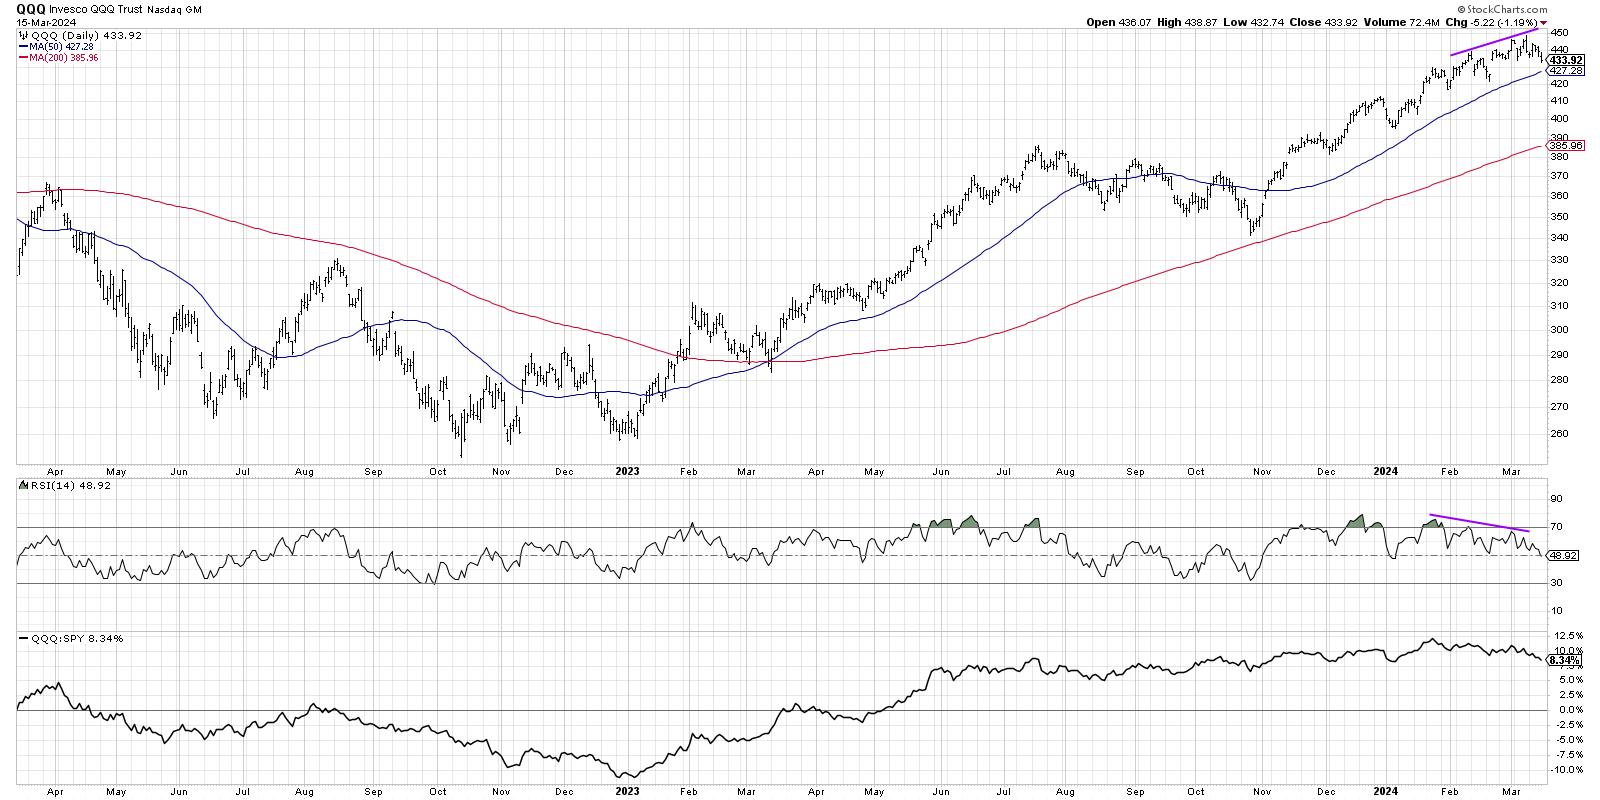
This classic sign of a bull market top is when price continues to trend higher while the RSI (or some other momentum indicator) begins to slope downwards. Think of this pattern as a train running out of steam as it reaches the top of a hill. This weakened momentum usually occurs at the end of a bullish phase, when buyers are exhausted and there just isn’t enough momentum left to push the markets much higher.
But it’s not just about weakening momentum. Breadth conditions, which remain fairly constructive for the broader equity space, have really deteriorated in the past ten weeks.
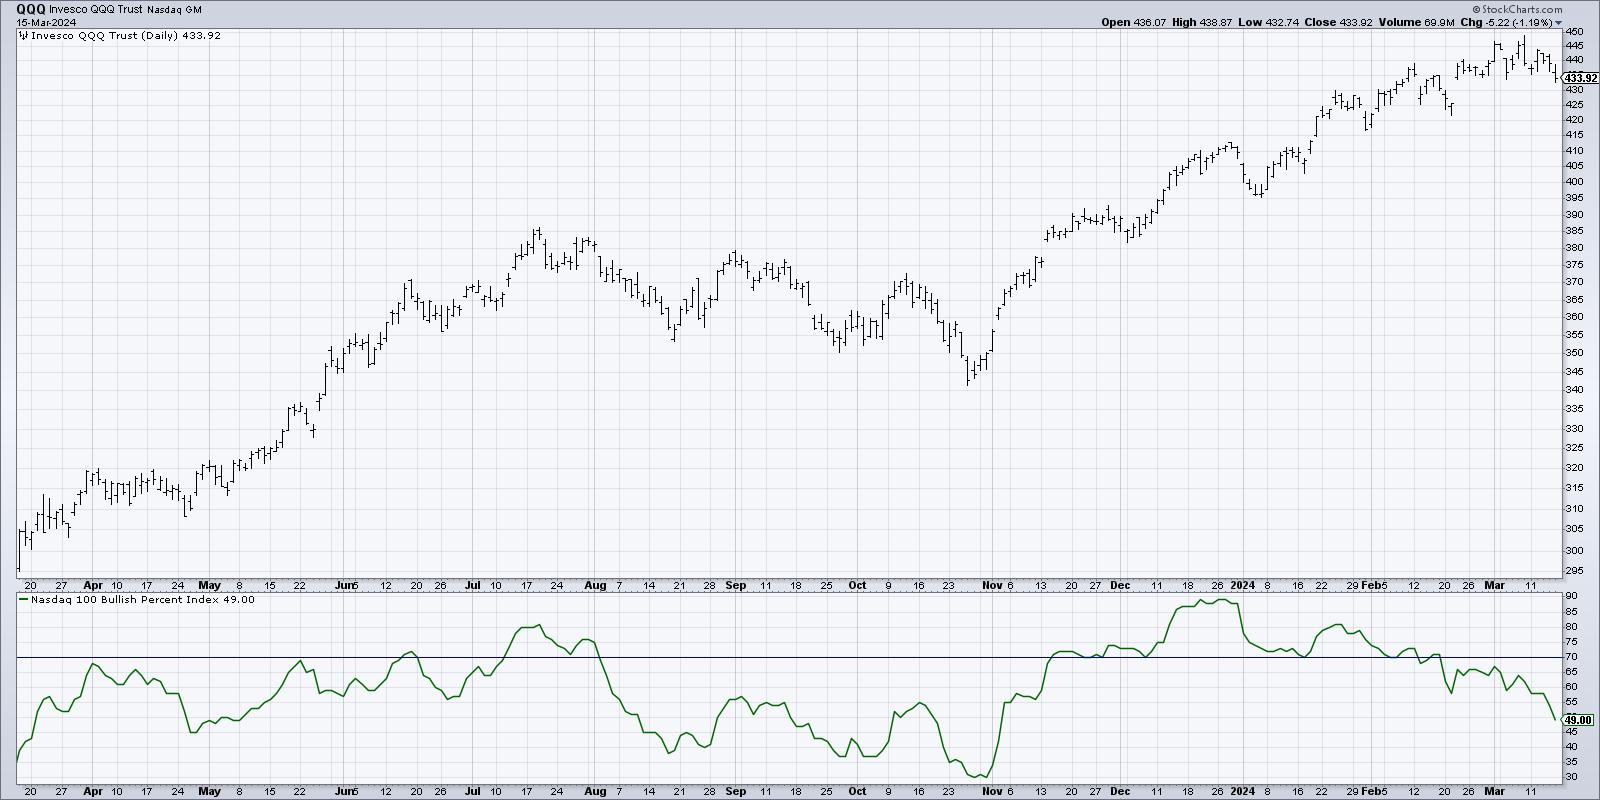
Here, we’re showing the Bullish Percent Index for the Nasdaq 100. This is a market breadth indicator based on point & figure charts, and basically measures how many stocks in a specific index are currently showing a bullish point & figure signal.
Note how, in late December, this indicator was around 90%, meaning nine out of every ten Nasdaq 100 members were in a bullish point & figure phase. This week, we saw the indicator finished just below 50%. This shows that about 40% of the Nasdaq 100 members generated a sell signal on their point & figure charts in 2024.
What’s very interesting about that particular development is that point & figure charts usually have to show quite a bit of price weakness to generate a sell signal. So names like TSLA, AAPL, and others are breaking down, which suggests that further upside for the QQQ would be limited until this breadth indicator improves.
Are you prepared for further downside for the QQQ and leading growth names? The first item in my Market Top Checklist has already been triggered. Join me for my upcoming FREE webcast on Tuesday, March 19th, where I’ll share the other six items on the checklist and reflect on what signals we’ll be watching for in the coming weeks. Sign up HERE for this free event!
So what if the Nasdaq 100 does continue lower? At what point can we confirm that a corrective phase has truly begun? I like to keep things simple, so, in terms of an initial trigger for a tactical pullback, I always start with the 50-day moving average.
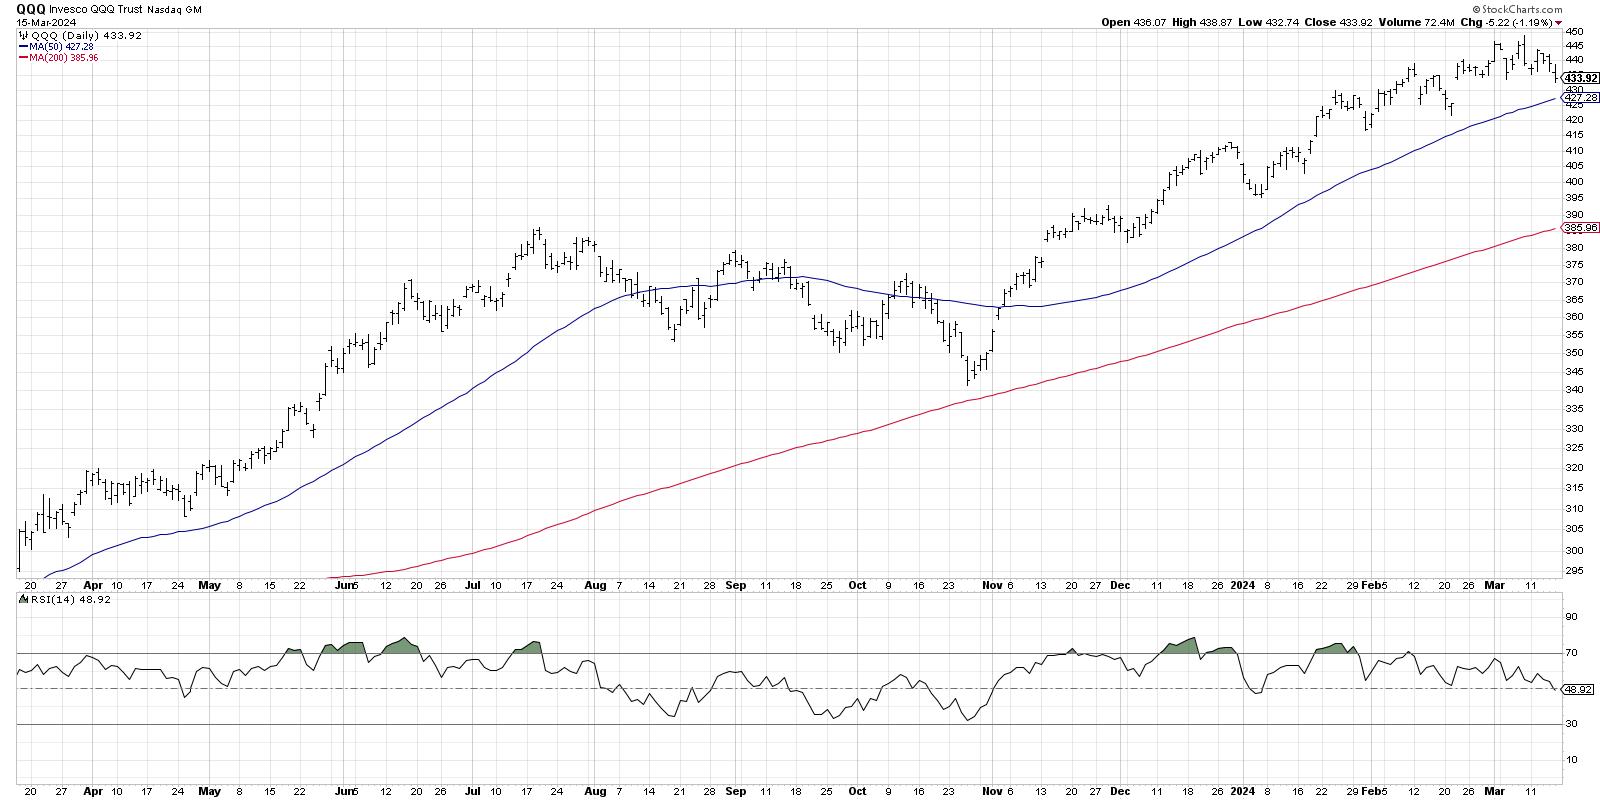
The 50-day moving average currently sits about $6 below Friday’s close, and also lines up pretty well with the February swing low around $425. So as long this level would hold, the short-term trend actually remains in good shape. A break below that 50-day moving average would tell me there is a much higher likelihood of further price deterioration.
But the 50-day moving average, while a simple and straightforward situation, is perhaps not the most effective way to gauge a new downtrend phase. Alexander Elder popularized the Chandelier Exit system in his books, and it represents a more nuanced version of a trailing stop because it is based on Average True Range (ATR).

Look back at the price peak in July 2023, and notice how the price remained above the Chandelier Exit through that price high. Soon after, the price violated the trailing stop to the downside, suggesting the uptrend phase was over and a corrective move had begun. Since the October 2023 low, the QQQ has consistently remained above the Chandelier Exit on pullbacks, as the price achieved higher highs and higher lows into March. After Friday’s drop, the Nasdaq 100 remains just above this effective trailing stop indicator.
So what if the Chandelier Exit is violated next week, and the QQQ begins to drop to a new swing low? What’s next for the Nasdaq 100?
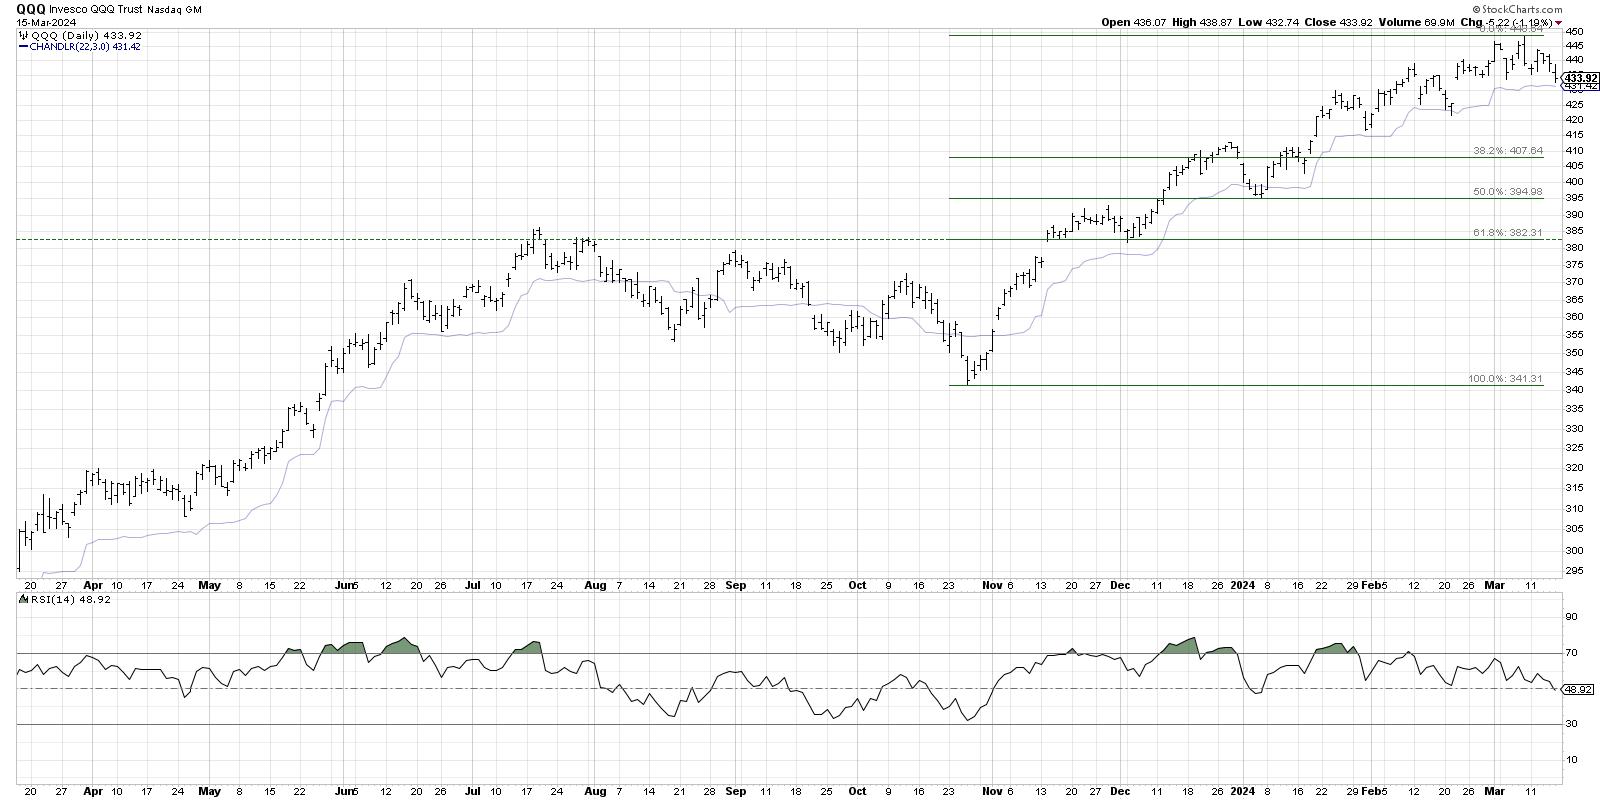
Fibonacci Retracements can be so helpful in identifying assessing downside risk, because they measure how far the price may pull back in relationship to the most recent uptrend. Using the October 2023 low and the March 2024 high, that would give an initial downside target around $408. Further support could be at the 50% level ($395) and the 61.8% level ($382).
Note how well these levels line up with previous swing lows, especially the 61.8% retracement level. That last support level lines up with the swing low in December 2023, as well as the price peak in July 2023. I refer to that sort of level as a “pivot point” because it has served as both support and resistance, and these are often important levels to monitor.
A number of the mega-cap growth stocks, such as TSLA and AAPL, have broken down in recent weeks. But the latest patterns of bearish momentum divergences and declining breadth conditions tell us that there may be further downside in store for the Nasdaq 100. By keeping a watchful eye on trailing stops and potential support levels, we can perhaps navigate choppy market waters using the power of technical analysis.
RR#6,
Dave
P.S. Ready to upgrade your investment process? Check out my free behavioral investing course!
David Keller, CMT
Chief Market Strategist
StockCharts.com
Disclaimer: This blog is for educational purposes only and should not be construed as financial advice. The ideas and strategies should never be used without first assessing your own personal and financial situation, or without consulting a financial professional.
The author does not have a position in mentioned securities at the time of publication. Any opinions expressed herein are solely those of the author and do not in any way represent the views or opinions of any other person or entity.


