As investors flock to Omaha, Nebraska in their annual pilgrimage to learn from the great Warren Buffett, it seems an opportune time to reflect on the technical evidence for Berkshire’s biggest holding, Apple (AAPL).
Today, we’ll consider AAPL using “multiple time frame analysis”, in which we analyze the same stock from three different time frames. This allows us to think about how the short-term fluctuations relate the medium-term trend, and how the medium-term trend fits into the longer-term secular trends at play.
First, let’s consider the short-term time frame using the daily chart.
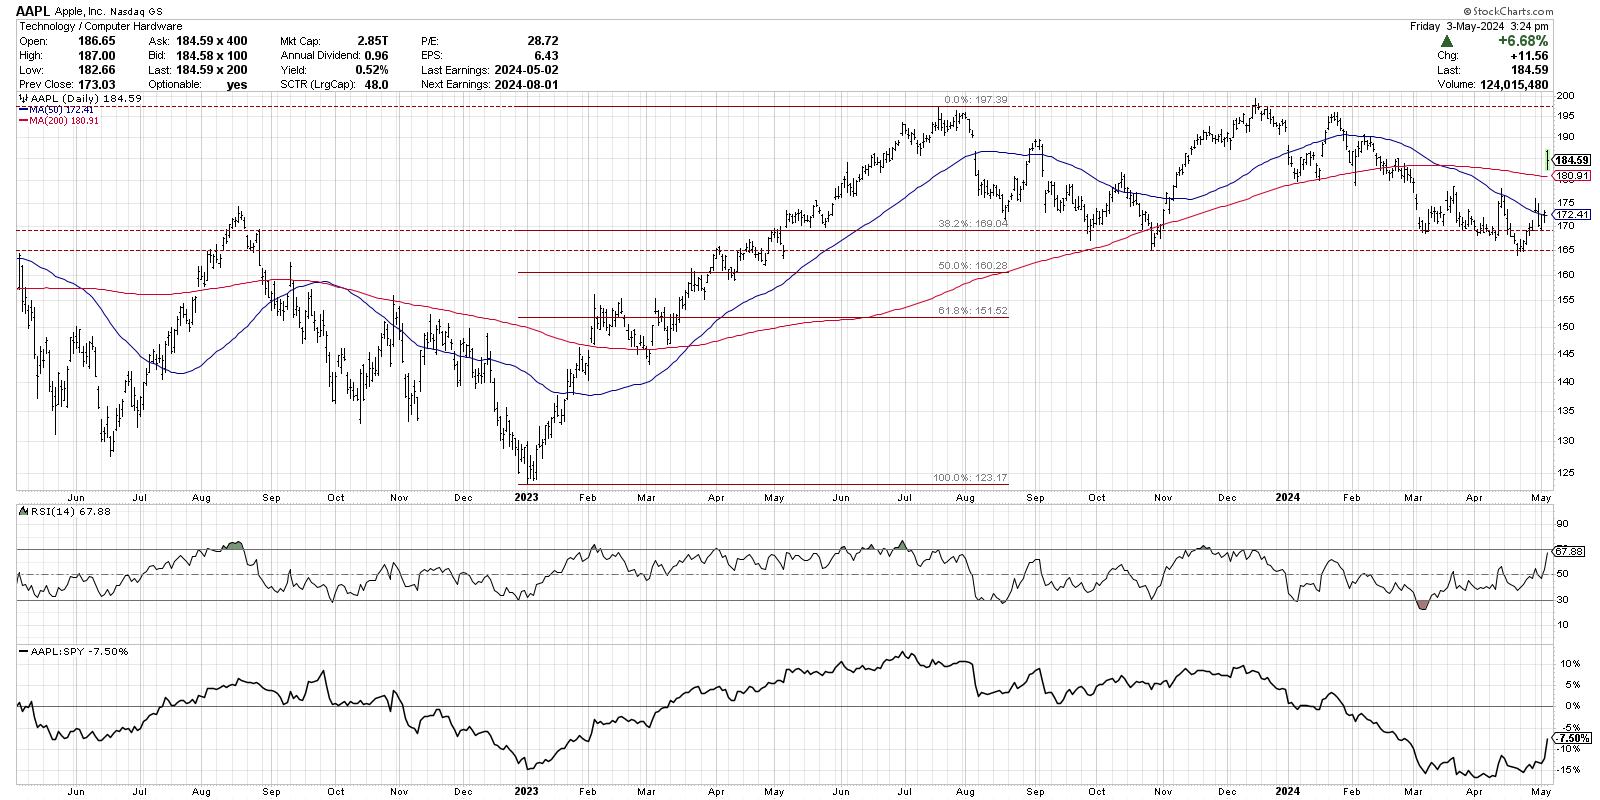
After an earnings release this week that disappointed investors on weaker iPhone sales, yet thrilled investors at the announcement of the largest buyback in Apple’s history, the stock gapped higher on Friday above the 200-day moving average. After the last two months of lower highs and lower lows, combined with RSI levels very consistent with bearish phases, the stock finally appears to have reversed that downtrend with higher prices and improved momentum.
For now, remaining above the 200-day moving average after the gap higher on Friday remains the most important factor on the daily chart. It will be very telling in the days and weeks to come if additional buyers are willing to step in and pay even more for this long-term market outperformer!
For the medium-term time frame, let’s consider the last ten months of price action, starting with the July 2023 high around $197. After achieving that peak, AAPL pulled back to a 38.2% retracement of the 2023 rally phase, finding support right around $169. Over the subsequent seven-to-eight months, Apple has been rangebound, bouncing between retests of the all-time high before returning down to test support in the $165-169 range.
This week’s gap higher appears to confirm that support in that range has once again held strong, giving a clear floor to the price action for the last year. With improving momentum, in the form of the RSI pushing above 60 on this rally, the stock appears to be strengthening. But until we see a confirmed break above the previous high around $197, I’m inclined to label the medium-term time frame as “neutral.”
Now let’s consider the long-term trend using the weekly chart.
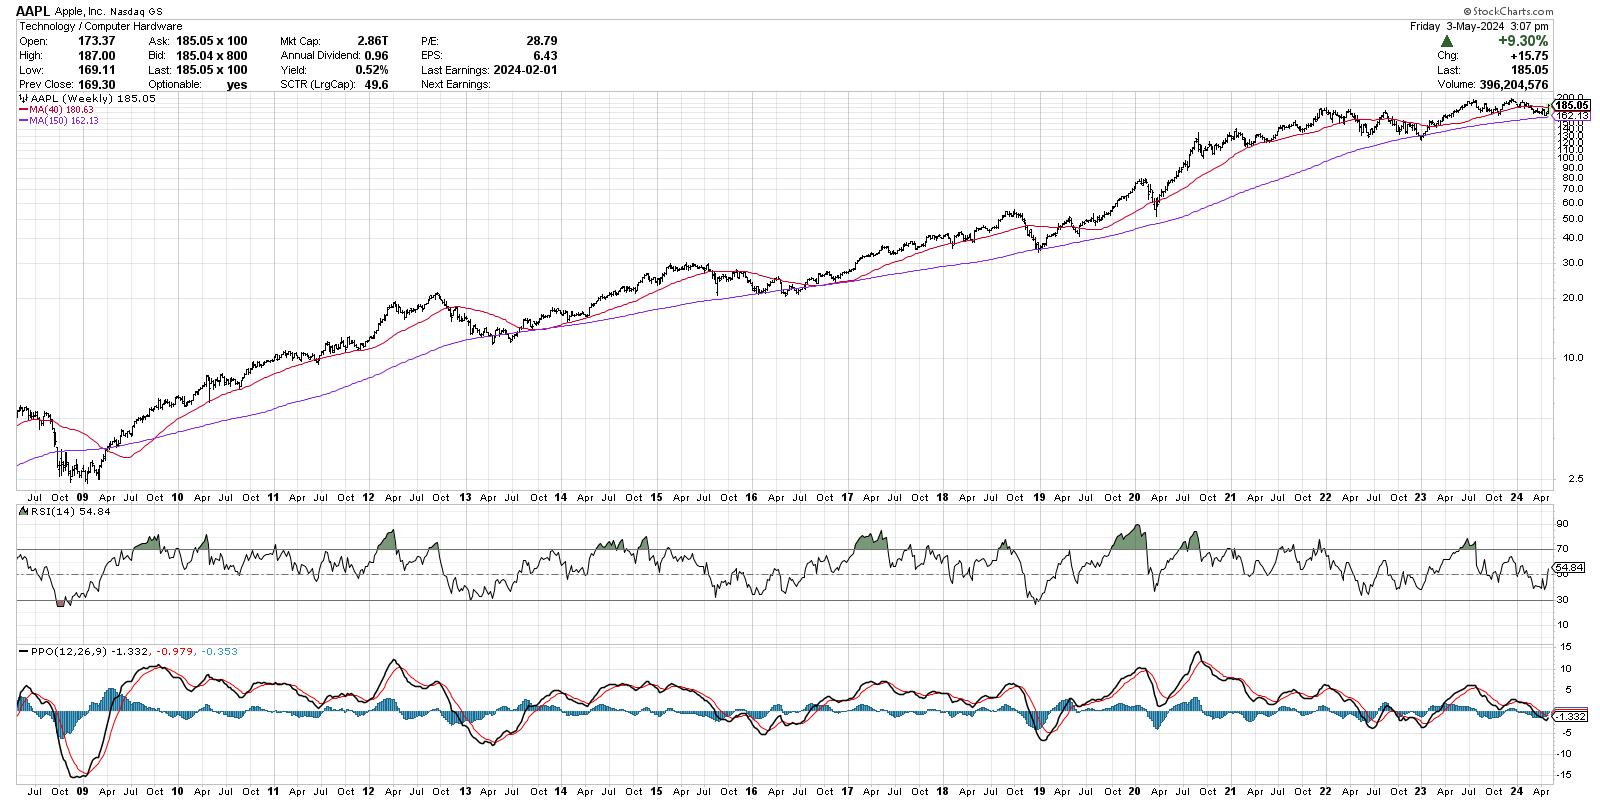
Quite simply, the long-term picture for AAPL is exceptionally strong. Since the 2009 market low, the stock has experienced numerous tests of an ascending 150-week moving average. And in 100% of those tests, the stock has rebounded higher, eventually making a new all-time high soon after.
Note the RSI levels on the weekly chart, showing that the momentum remains in the bullish range since late 2018. This suggests that the long-term momentum is positive, and that pullbacks to moving average support should be considered opportunities to capitalize on short-term market weakness.
Do you think Apple provides a decent opportunity in Q2, after pulling back to test long-term moving average support? Watch the video below, and then drop a comment there with your vote!
RR#6,
Dave
P.S. Ready to upgrade your investment process? Check out my free behavioral investing course!
David Keller, CMT
Chief Market Strategist
StockCharts.com
Disclaimer: This blog is for educational purposes only and should not be construed as financial advice. The ideas and strategies should never be used without first assessing your own personal and financial situation, or without consulting a financial professional.
The author does not have a position in mentioned securities at the time of publication. Any opinions expressed herein are solely those of the author and do not in any way represent the views or opinions of any other person or entity.


