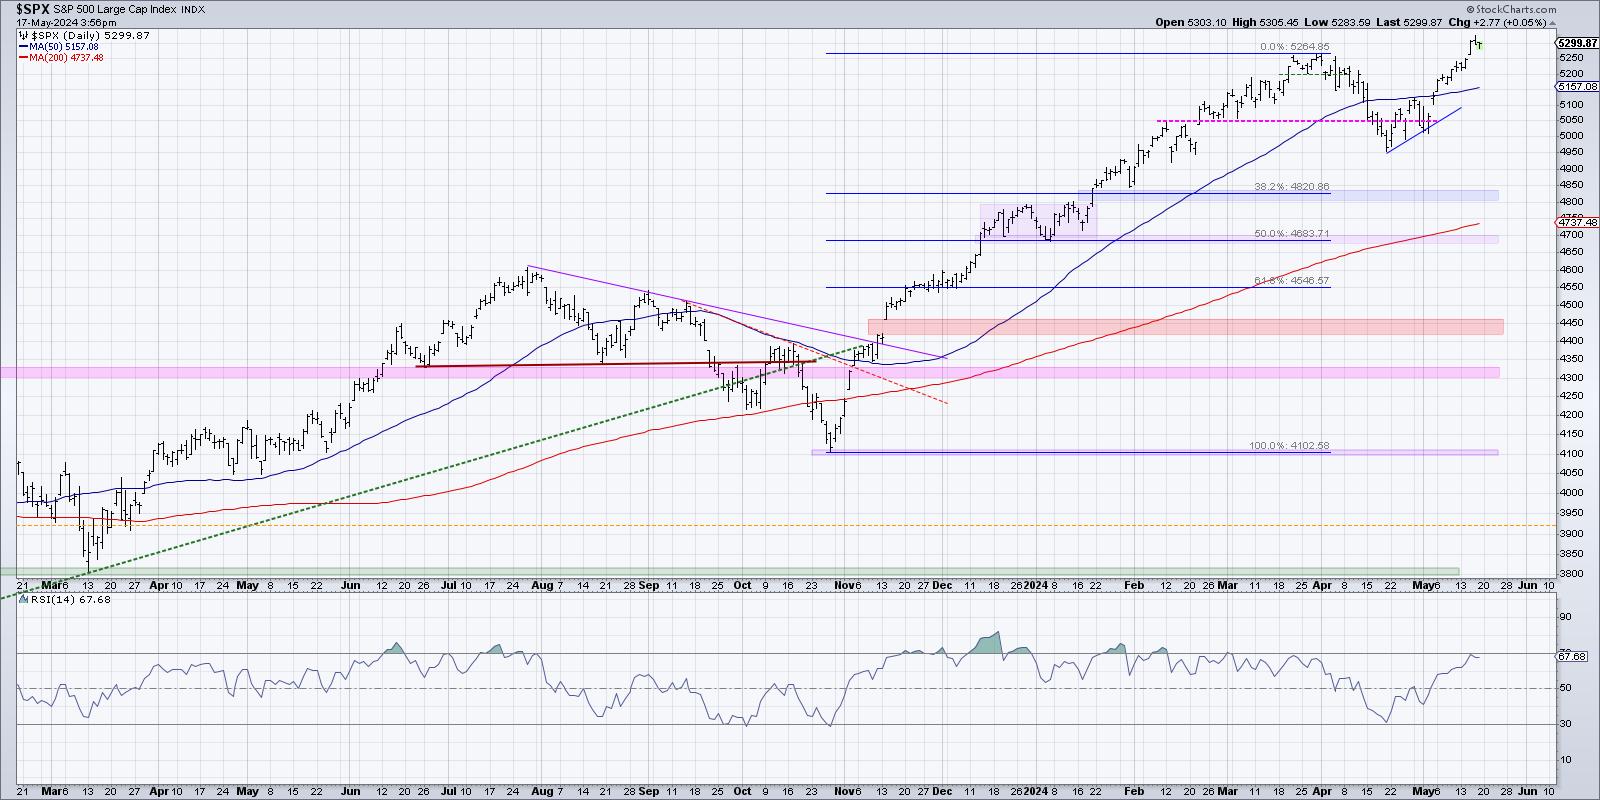
As the S&P 500 and Nasdaq 100 have once again made new all-time highs, and the Dow Jones Industrial Average has briefly broken above the 40,000 level for the first time, how should we think about further upside for our equity benchmarks?
There are two general ways to play a chart pushing higher into uncharted territory, pun intended. First, we can use technical tools to identify potential upside objectives, using things like Elliott Wave or Gann or pattern measurements. I tend to avoid this sort of approach, only because I’ve learned that when something is working, you want to keep it working as long as possible!
Peter Lynch famously compared this approach to growing a garden. If you’re selling your winners and doubling down on your losers, it’s like pulling your flowers and watering your weeds! To grow a beautiful garden, you want to pull the weeds and water your flowers. So in a portfolio context, that means riding winning stocks higher as long as they continue to help your portfolio.
So the second general approach is to become a trend-follower, tracking the uptrend and looking for signs of any change in that trend. Here’s one chart I’m using now to make that general assessment for the S&P 500.
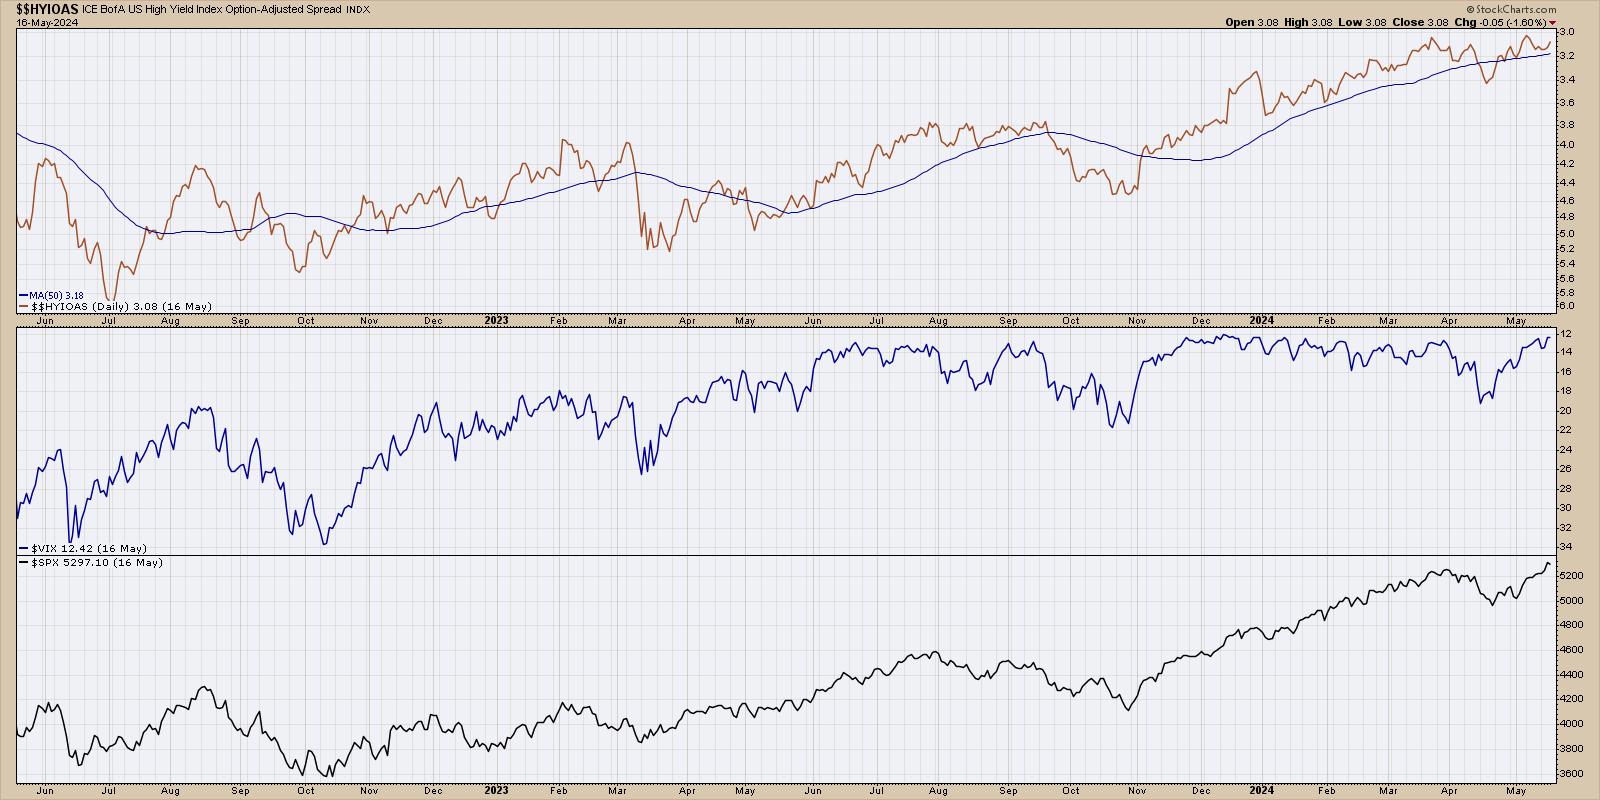
This chart has three series, starting with a high yield index option-adjusted spread from Bank of America. If you’re confused by that wordy title, allow me to simplify. Bonds are quoted in terms of a spread above a risk-free rate. So US Treasury bonds are considered a “risk-free investment” because it is highly unlikely that the US government would be unable to pay interest on their debt obligations. Any corporate bond, issued by a particular company, by definition will bear additional risk than a Treasury bond. So a corporate spread of any kind tells you the additional yield you should expect to receive for taking on that additional risk.
Lots of corporate bonds include call options, meaning the bond can be redeemed by the company before maturity. In this case, we’re using an “option-adjusted spread”, which means you are stripping out those options to compare bonds on more of an apples-to-apples basis. And this spread is based on high-yield or “junk” bonds, meaning the bonds of risky companies with lower credit scores.
So to summarize, we are tracking how much of a spread bond investors are demanding for taking on the risk of junk bonds. I’ve plotted this series upside down because wider spreads mean additional risk, which usually means bad news for equities. You can see that when spreads are widening (the line is going lower on this chart), that tends to coincide with downtrends for the S&P 500 (bottom panel). Conversely, narrowing spreads tend to coincide with uptrend for the major equity indexes.
High-yield spreads are currently at the lowest levels in years, suggesting that bond investors are expecting a low-risk environment for the foreseeable future. If and when we see spreads start to widen, as they did in early April, that would be a bearish sign for stocks.
The middle series shows the VIX, because markets tend to rise on low volatility and stocks tend to drop with much higher volatility conditions. I’ve plotted this series upside-down as well, because it makes it easier to compare volatility to the S&P 500 trend. The VIX is also at its lowest levels that we’ve seen in the last two years, demonstrating what I would describe as a low-volatility environment. If and when the VIX would increase above 15, and especially if it would eclipse the 20 level, that would indicate a much more bearish environment for risk assets like the S&P 500 and Nasdaq 100.
To be clear, this chart is currently quite bullish, with the S&P 500 trending higher along with narrow high-yield spreads and very low volatility. If and when we see a widening of credit spreads, and if and when volatility begins to increase, that could be a great opportunity for equity investors to really question the sustainability of the bull market phase.
RR#6,
Dave
P.S. Ready to upgrade your investment process? Check out my free behavioral investing course!
David Keller, CMT
Chief Market Strategist
StockCharts.com
Disclaimer: This blog is for educational purposes only and should not be construed as financial advice. The ideas and strategies should never be used without first assessing your own personal and financial situation, or without consulting a financial professional.
The author does not have a position in mentioned securities at the time of publication. Any opinions expressed herein are solely those of the author and do not in any way represent the views or opinions of any other person or entity.


