 If you logged into the CNBC website on Thursday morning, you might have seen the headline, “Wells Fargo says don’t buy this rally, fundamentals don’t support it.“
Investors relying solely on fundamentals and not knowing how to read market technicals may be at a disadvantage when market analysts issue such warnings. It makes you wonder when they might finally give the green light if the market remains bullish.
Wells Fargo issued a similar warning back in November 2023. Whether analysts are right or wrong isn’t the point. The real point is that it’s important to have the right tools to anticipate a move, regardless of what fundamental analysts say.
A Look At November 2023
Let’s look at a weekly chart of the S&P 500 index ($SPX).
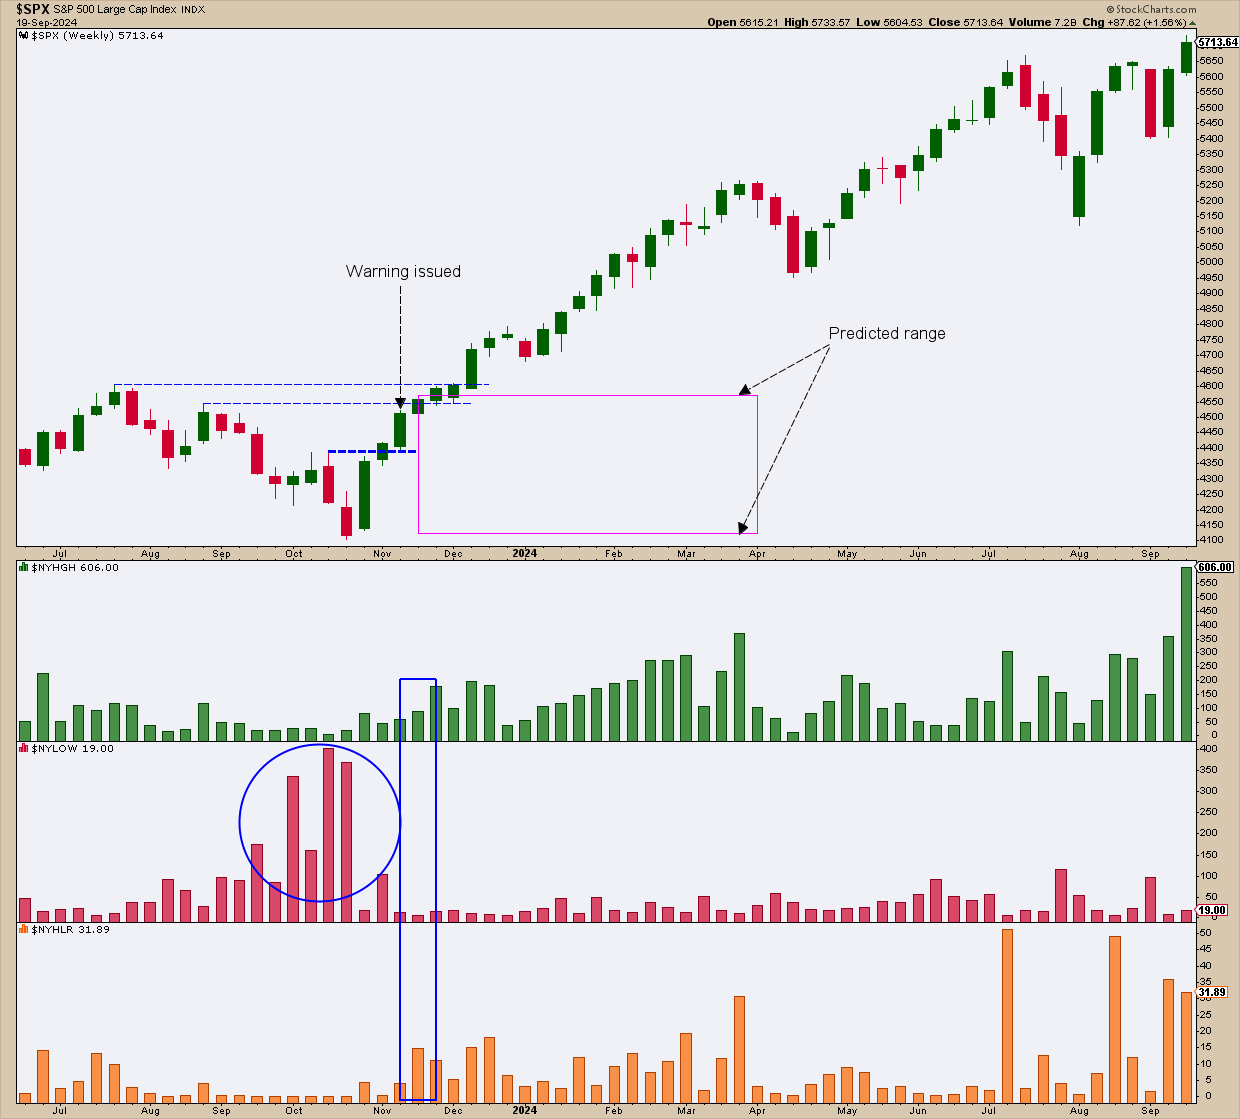
CHART 1. WEEKLY CHART OF THE S&P 500($SPX). Coming off a wave of selling, Wells Fargo warned not to buy into the recovery.Chart source: StockCharts.com. For educational purposes.
The following are points to note about the above chart.
The warning. Note the week that Wells Fargo issued a “don’t buy this rally” warning (black arrow). The S&P 500 just broke above its last swing high at around 4,450.
The context. Look at the NYSE New Highs, NYSE New Lows, and NYSE New High/New Low ratio. The market was coming off a heavy wave of selling (blue circle in $NYLOW panel). Yet, on the week of the warning, note that new highs were ticking up (blue vertical rectangle).
The expectation. Bank analysts thought the S&P 500 might be stuck in a range between 4,100 and 4,600 (magenta rectangle in price chart), citing headwinds ahead. Indeed, there were two more technical headwinds in the form of resistance at 4,540 and 4,600.
The outcome. The S&P 500 kept going higher as soon as it broke above 4,600. So much for analyst expectations.
What You Could Have Done
Nobody could have predicted what the S&P 500 was going to do. So, if you simply went long on a breakout of 4,450 and put a stop either below that level or, if you were willing to risk more, below 4,100, you would have seen the S&P 500 break above the resistance levels overhead as it soared to new heights. It was all about watching the key levels.
What’s Happening in Light of the New Warning
Let’s look at a daily chart.
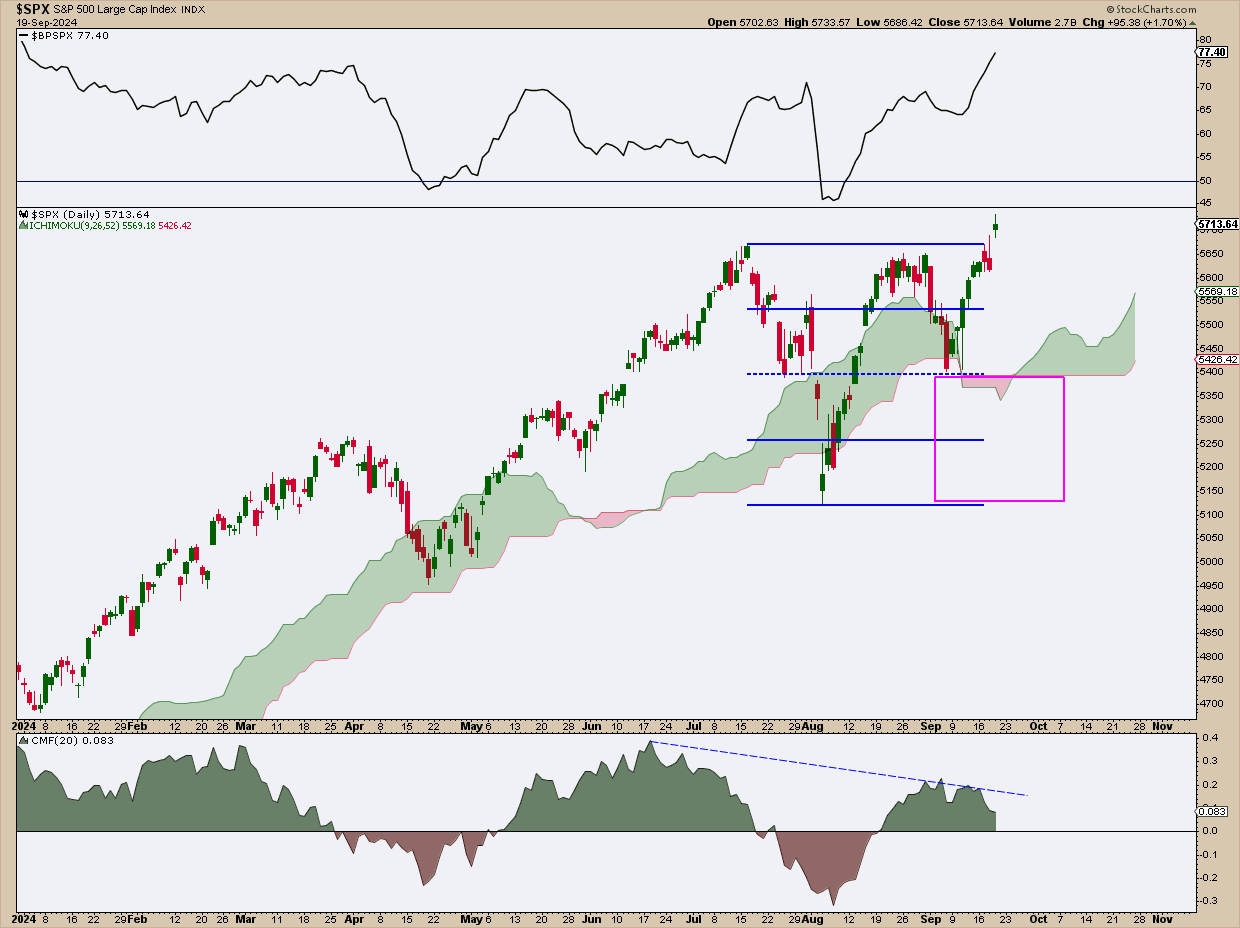
CHART 2. DAILY CHART OF THE S&P 500. There is plenty of downside room for the index to decline while maintaining its uptrend.Chart source: StockCharts.com. For educational purposes.
Whether fundamentals do or do not support the S&P 500’s current rally, what you want to pay attention to are the following:
- So far, the S&P Bullish Percent Index (BPI), a market breadth indicator, is favoring the bulls as the levels (77%) are well above 50% and rising, meaning that over 77% of S&P 500 stocks are flashing Point & Figure buy signals.
- The Chaikin Money Flow (CMF), however, is warning of a potential pullback, as buying pressure is on the decline.
- An Ichimoku Cloud has been plotted to measure the technical bullishness of the trend (thick green is a good signal) and to anticipate a potential support range.
- But to zoom in on a potential support range, look to the Quadrant Lines to see how it divides the current price action into four zones. First and second quadrants indicate strength despite a pullback. Indications of weakness begin in the third quadrant (below the 50% level) and especially the fourth quadrant (below the 75% level), which is where you should begin worrying. These quadrants are also highlighted by the magenta rectangle.
- A close below the bottom of the quadrant, followed by further declines, means that the current uptrend is no longer valid.
Closing Bell
Wells Fargo may have said, “Don’t buy this rally,” but here’s the deal: if you can’t follow key technical levels, you risk missing out on key moves (whether the forecast was right or wrong). It happened before. Will it happen again? We don’t know, so watch those levels.
Disclaimer: This blog is for educational purposes only and should not be construed as financial advice. The ideas and strategies should never be used without first assessing your own personal and financial situation, or without consulting a financial professional.


