 When going through your morning trading routine, you’re likely to tune into the news for unfolding events, run technical scans, check sentiment and breadth indicators, and utilize any other tool that can provide a snapshot of what’s going on “now” before or during the market’s opening hours. After all, each day presents something new.
But what if a stock makes headlines for an unusually massive jump due to a significant news event? How might you go about assessing the favorability of that stock amid a rush of stampeding bulls? That was the case Monday morning with Super Micro Computer Inc. (SMCI).
On Monday morning, December 2, SMCI claimed the top position in StockCharts’ Market Movers tool, featured on the Dashboard. The ranking highlighted SMCI as the most actively traded stock across the S&P 500 and NASDAQ, as illustrated below.
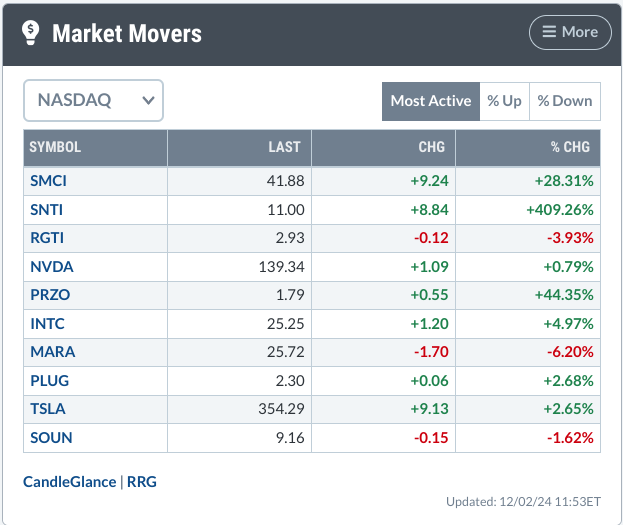
FIGURE 1. MARKET MOVERS PANEL FOR NASDAQ ON DECEMBER 2. SMCI was the most actively traded stock in the S&P 500 and the Nasdaq.Image source: StockCharts.com. For educational purposes.
Can SMCI Stock Recover After Its 85% Plunge?
Typically, when analyzing a stock that’s performing relatively well, you’d compare it to a benchmark like the broader market (S&P 500) or its sector, checking various breadth indicators to see how the stock and its benchmarks are performing.
SMCI’s dramatic underperformance renders traditional comparisons to benchmarks unnecessary. Yes, it was that bad. Once a high-flying AI stock, SMCI made headlines after plummeting 85% just weeks ago amid concerns over its financial integrity. While this event grabbed attention, the stock has been on a steady downward trend since the start of the year.
Despite this, on Monday, shares jumped about 29% after a special committee reaffirmed that there was “no evidence of misconduct” by the company. This was enough to ease investor fears despite the risks that might still weigh on the stock. Given the dramatic surge, the news likely spurred many bullish investors to seize the opportunity, betting on a rebound at “bargain basement” prices.
However, “not so fast,” as a daily chart of SMCI would indicate.
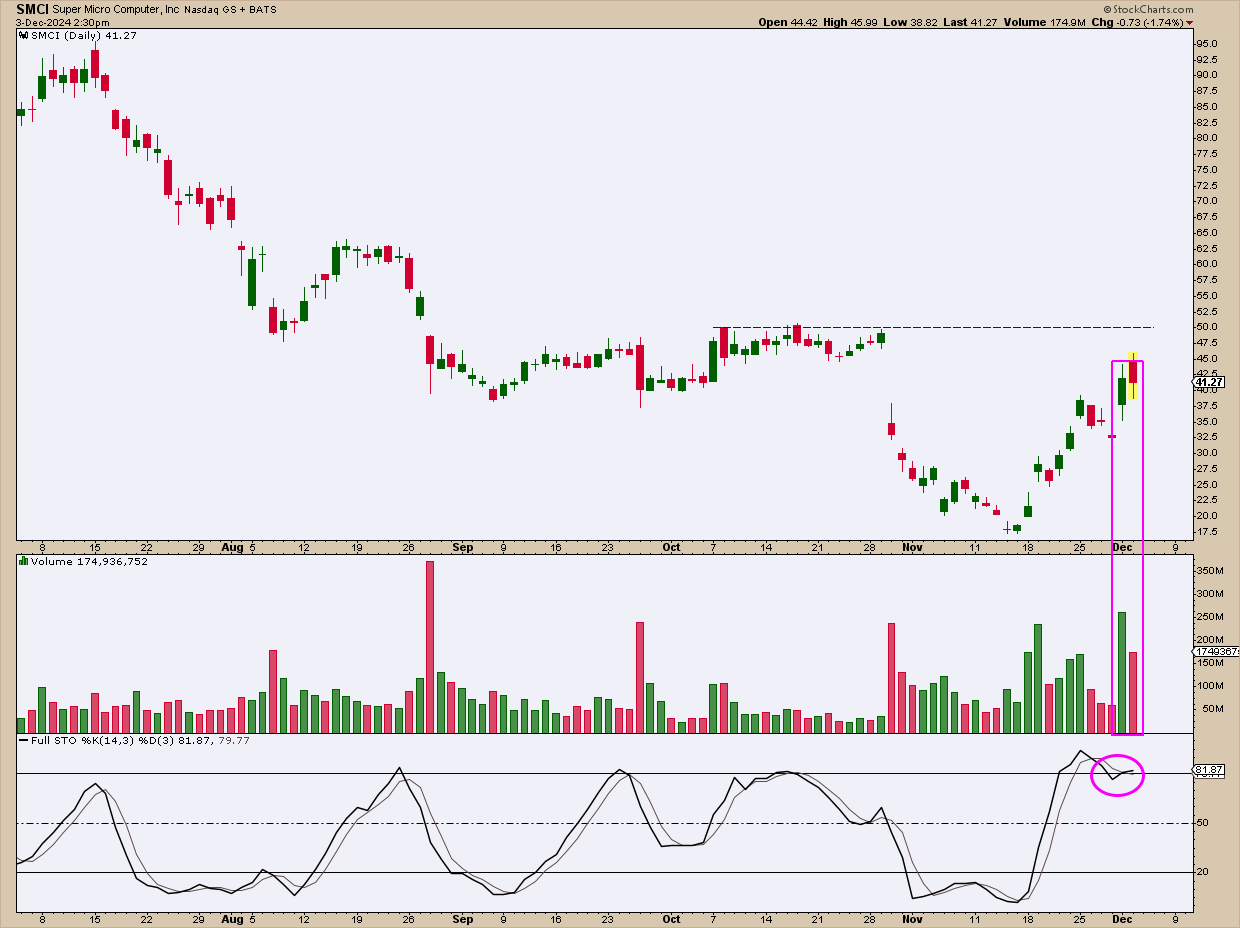
FIGURE 2. DAILY CHART OF SMCI. The day’s impressive surge may not look so optimistic when viewed from a larger context.Chart source: StockCharts.com. For educational purposes.
Look at the volume spike coinciding with Monday’s price surge (magenta rectangle). Both may be slightly notable relative to previous sessions. In the bigger picture, though, it’s not a remarkable event. What stands out, however, is the resistance level near $50 (indicated by the blue dotted line) and the Stochastic Oscillator‘s “overbought” reading (marked by the magenta circle), suggesting that momentum may soon slow. In short, watch what the price does at that level.
But let’s suppose that the current reversal eventually sustains itself and breaks above resistance at $50. The next step would be identifying potential price targets or reversal points ahead. Additionally, it’s important to monitor key longer-term indicators for further confirmation.
How to Trade SMCI Stock: Entry/Exit Points and Price Targets
Let’s switch over to a weekly chart.
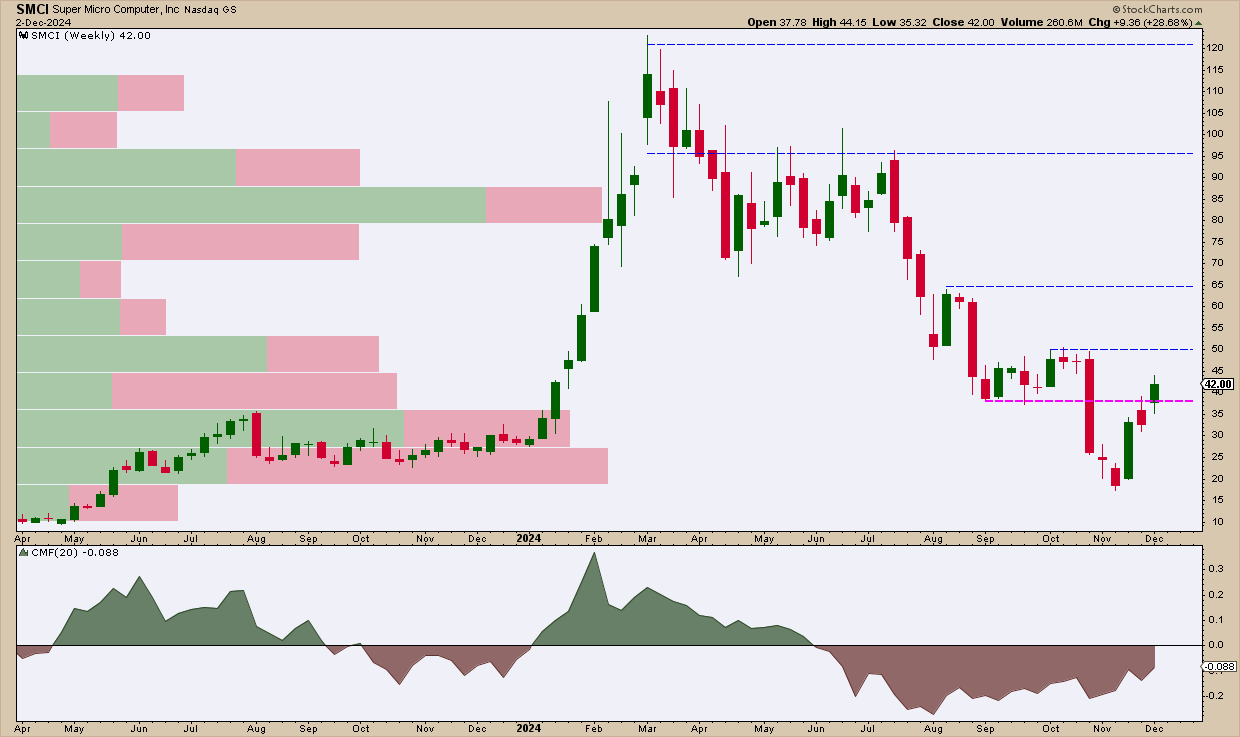
FIGURE 3. WEEKLY CHART OF SMCI. The significance of historical volume is quite telling in this chart. The $20 and $90 price ranges have seen the highest trading volumes.Chart source: StockCharts.com. For educational purposes.
If the price breaks above the immediate resistance level at $50, the next key levels to monitor are $65, $95, and $120 (its all-time high). These levels, indicated by dashed blue lines, could serve as potential points for profit-taking, resistance, or reversals, depending on the broader technical and fundamental context. In short, these are your potential price targets. A break above $50 would make for a favorable entry point, and a good stop-loss level would be at $41, marked by the magenta dotted line, as it served as support from September through October.
A key indicator to watch if price breaks above $50 is the Chaikin Money Flow (CMF). Ideally, you would want to see the CMF rise above the zero-line, as it would indicate that buyers are taking control of the stock, suggesting volume-driven buying pressure that might be adequate enough to lift the stock higher. If SMCI falls before breaking above $50, what’s the likelihood of another bounce at $20, forming a double bottom?
While SMCI’s bounce is a foggy mix of fundamental speculation, leading SMCI bulls to trade technically until more definitive information on the company’s prospects becomes clearer, the Volume-by-Price indicator offers some valuable insight. A Volume-by-Price analysis suggests that the $20 and $90 price ranges have experienced the highest trading volumes. This means that these ranges might serve as significant support and resistance levels, respectively, due to heavy trading concentrated at these prices. So, if SMCI’s price declines, it is likely to find support once again at the $20 level.
At the Close

SMCI’s dramatic 29% rebound drew much attention, but you should approach such euphoria cautiously, tempering the optimism with technical reality. The Market Movers tool is useful for drawing attention to stocks experiencing the highest levels of trading volume and the biggest percentage gainers and decliners. But just because you see a bull rush doesn’t mean you should immediately jump into the fray. Watch the key levels discussed above and if SMCI signals an entry, set your sights on the targets and set your stops as well. If SMCI trends higher, consider trailing your stops higher to reduce your losses or ensure your profits.
Disclaimer: This blog is for educational purposes only and should not be construed as financial advice. The ideas and strategies should never be used without first assessing your own personal and financial situation, or without consulting a financial professional.


