 As part of your daily trading routine, you likely start the day by checking the news and stock prices to identify potential market opportunities. However, as you already know, news and price performance can only give you a snapshot context—a starting point for a much more thorough analysis.
Financial media often highlights the price performance of notable stocks, but understanding its significance is another matter. A single price snapshot doesn’t uncover trading opportunities, but analyzing price within the context of consistent movement can.
One way to get a comprehensive view of this context is using a MarketCarpets chart configured to display [Up Days] – [Down Days].
What is MarketCarpets’ Up Days – Down Days?
This indicator setting counts the number of days a stock moves higher, then subtracts the number of days it moves lower, during a specified timeframe. (It’s best to start with at least a 5-day change.)
Why use this indicator? It’s all about consistency, or finding stocks with consistent increases or decreases. For instance, a stock’s one-day jump tells you very little. From where did it jump? What was its price action in the previous days? What is its trend context?
A single day’s movement can be unreliable simply because it doesn’t say much beyond the current day. You’ll have to check the charts to get a broader context. Fortunately, you can save time and get an overview of all stocks using MarketCarpets’ Up Days – Down Days setting.
For example, look at what happened in the Technology Sector -> Software Industry on Wednesday (see image below). The stock that pops out immediately is Microsoft Corp. (MSFT), not only because of the size of its market cap but also the company’s overall significance in the tech industry and beyond.
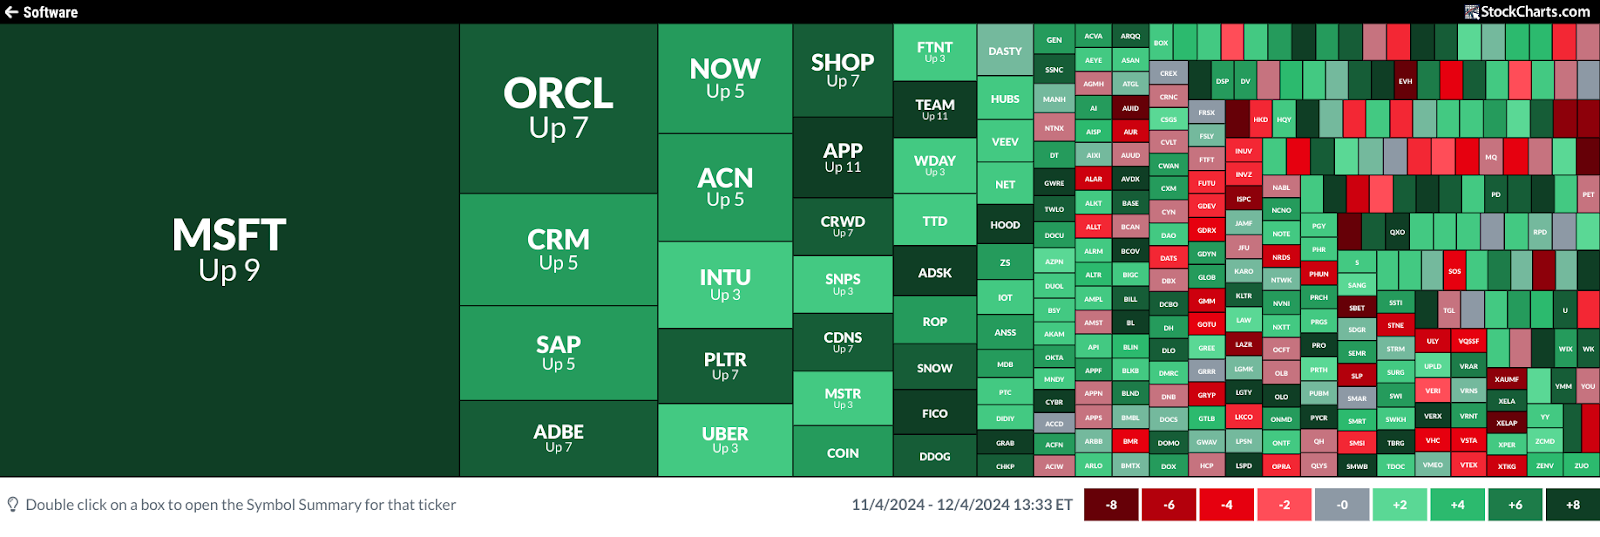
FIGURE 1. MARKETCARPETS CHART OF SOFTWARE SET TO ONE-MONTH VIEW OF UP DAYS – DOWN DAYS. MSFT, up 9 days, is the largest stock by market cap in this segment.Image source: StockCharts.com. For educational purposes.
If you hover over the square, you’ll get a small pop-up showing you MSFT’s chart. But we’ll take a closer look to drill down into the broader context of this MarketCarpets reading. MSFT has had nine up-days minus down-days over the last month, but what exactly does that mean, and does it present a tradable opportunity?
Let’s start with a daily chart of MSFT.
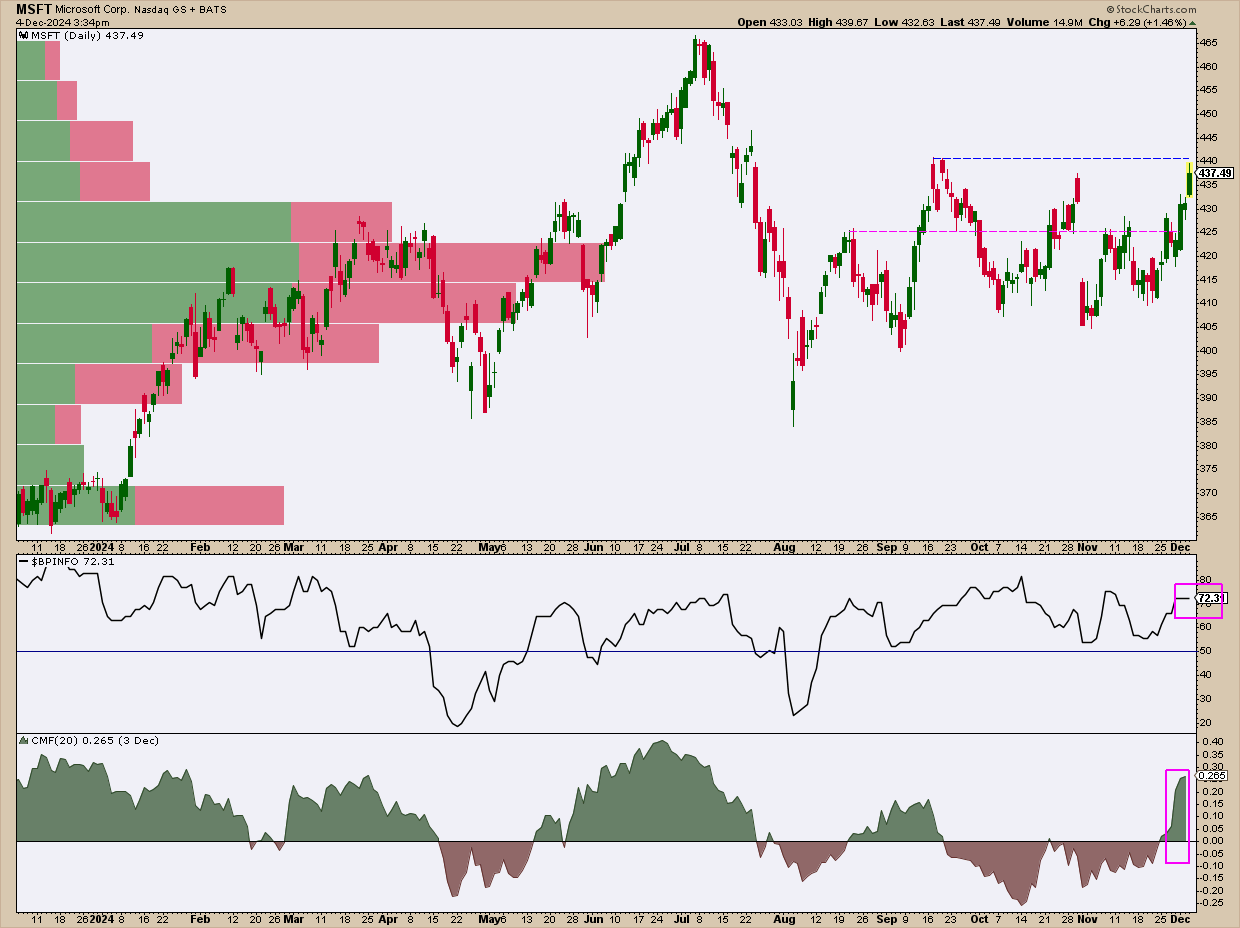
FIGURE 2. DAILY CHART OF MSFT. After being in a trading range for about four months, Is MSFT poised for a breakout?Chart source: StockCharts.com. For educational purposes.
Given Microsoft’s significance in all things “tech,” it wouldn’t hurt to get a breadth reading on the sector’s performance. To this end, the S&P Technology Sector Bullish Percent Index, $BPINFO (see magenta square), tells you that over 70% of tech stocks are exhibiting Point & Figure buy signals, which indicates cautious bullishness, as some stocks may be overbought.
MSFT’s sideways movement, a range that lasted nearly four months, coincided with negative buying pressure in the Chaikin Money Flow (CMF). But the current attempt to break above resistance at $440 is accompanied by a notable surge in buying pressure (see magenta rectangle in the CMF panel).
A bullish trader would likely enter a long position at a break of $440, set a stop loss at $425 (given the concentration of trading volume — see the magenta line and Volume-by-Price), and watch $466, MSFT’s all-time-high as a technical target price (fundamental targets will differ).
In contrast, let’s look at the worst performers using the same MarketCarpets view. You can do this by cycling through each sector on MarketCarpets to get a comprehensive view of which industries seem to be underperforming. Here’s what I discovered in the Investment Services industry within the Financial sector (see image below).
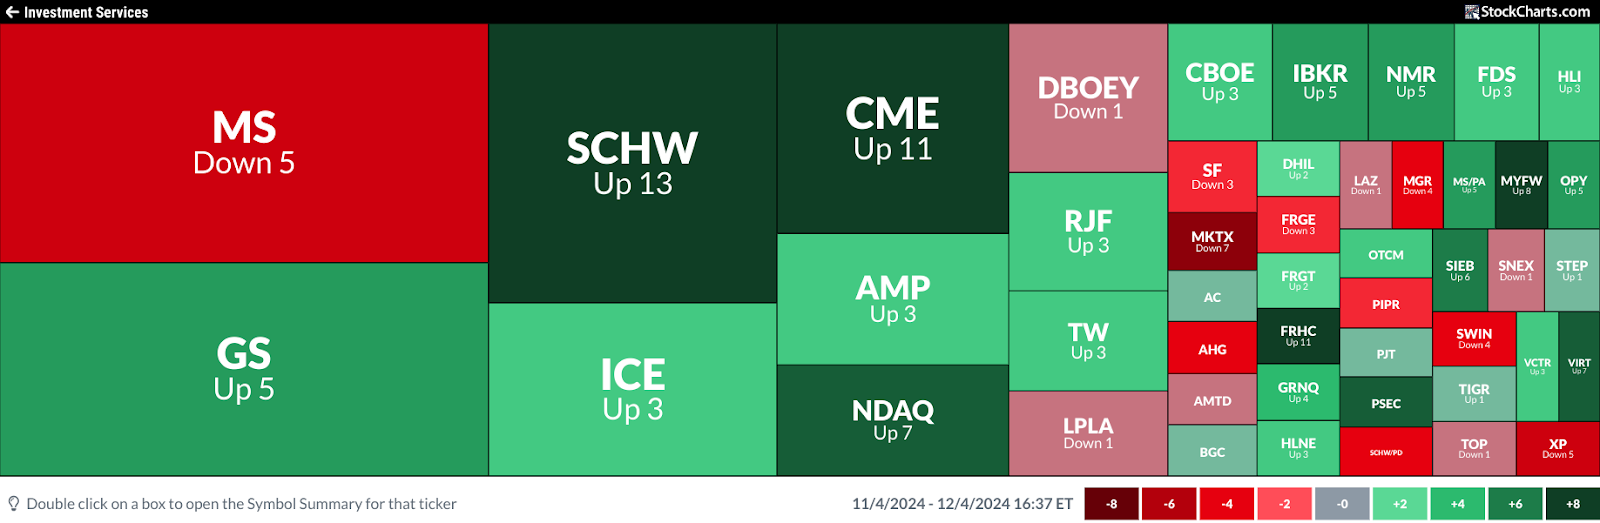
FIGURE 3. ONE-MONTH MARKETCARPETS CHART OF THE FINANCIAL SECTOR’S INVESTMENT SERVICES INDUSTRY. Among the big brokerages, Morgan Stanley (MS) appears to be one of the bigger underperformers.Image source: StockCharts.com. For educational purposes.
If the MarketCarpets’ Up Days minus Down Days calculation indicates weakness or underperformance, it helps to look at the wider context of trend, momentum, and overall technical strength.
Morgan Stanley (MS) has experienced more down days than up days over the past month relative to its peers. Could this signal weakness weighing upon its share price? Let’s shift to a daily chart for a closer look.
FIGURE 4. DAILY CHART OF MORGAN STANLEY. A rounding top pattern can indicate a toppy stock, although it can bounce off the bottom of the pattern formation.
MS is forming a rounding top pattern coming off a wide gap following a flag pattern. A rounding top is traditionally considered a bearish reversal pattern (though it can sometimes do the opposite and bounce at the bottom of the formation, so watch out). If it breaks below $128, the bottom of the formation, it’s likely to find support at the 50-day Simple Moving Average (SMA) line or the most recent swing high point at $120.
Some traders might see this as a shorting opportunity (below $128), while others may see it as a buying opportunity (at $120, for instance). Whatever you decide might be the better way to go, it’s important to consider a few other mixed signals:
- The stock’s technical strength, as measured by the StockChartsTechnicalRank (SCTR) line, is favorably bullish at 84, indicating that the current weakness might be setting up for a minor pullback. A break below 70 would indicate technical weakness.
- The CMF indicates that selling pressure dominates the stock’s momentum, indicating the possibility that the stock’s reversal may be more than a mere “breather.”
Whether MS is poised for a minor pullback or a larger reversal, you’ll gain clarity once the price reacts to the key levels, allowing you to make your move.
These are just a few examples of many stocks you might have found using the MarketCarpets’ Up Days – Down Days tool. Try it out yourself and create a ChartList with your top 5 to 10 stocks. This will help you track their performance and identify trading opportunities over time.
At the Close
Incorporating MarketCarpets into your daily trading routine can significantly enhance your ability to find trading opportunities at a near glance. The Up Days – Down Days indicator, in particular, offers valuable insights into consistency in near-term price trends, helping you focus on stocks with sustained upward or downward movements. Make this tool a part of your routine, and build a ChartList to monitor the stocks you find.

Disclaimer: This blog is for educational purposes only and should not be construed as financial advice. The ideas and strategies should never be used without first assessing your own personal and financial situation, or without consulting a financial professional.


