“The market goes up the escalator and down the elevator.” This is a quote that one of my mentors, Ralph Acampora, shared with me when I visited him years ago at his farm in Minnesota. This market truism is based on the fact that volatility tends to remain low in bull market phases, and volatility tends to spike higher during bear phases.
Why does this tend to happen? Well, when everything is going well, and investors are optimistic, they tend to slowly accumulate positions on the way up. But when investors get nervous, do calmly and rationally begin entering sell orders? They do not. Panic ensues, selling begets further selling, and what’s known as a “waterfall decline” quickly emerges on the charts.
A number of my recent podcast interviews have included discussions of the VIX and why volatility may be the most important metric to follow. My fellow StockCharts contributor Tom Bowley (a fan of the Carolina Panthers, a team with an equally painful record to my Cleveland Browns) told me it was at the top of the list of warning signs to watch for into early 2025.
Russell Rhoads, who literally wrote the book on trading the VIX, talked in detail about the relationship between the VIX and the S&P 500. In his experience, the key was to look for the SPX to rally on higher volatility, suggesting that panic was simmering under the surface.
Let’s review three charts to track the VIX to help us identify when this low-volatility uptrend may be nearing its final stages.
Low Volatility Implies Conditions are Favorable
Since popping to one of its highest levels in history back in August, the VIX spent September and October ranging between 15 and 23. In November, the VIX came off a short-term peak around 23 and progressed down into the low teens, where we find the VIX in early December.
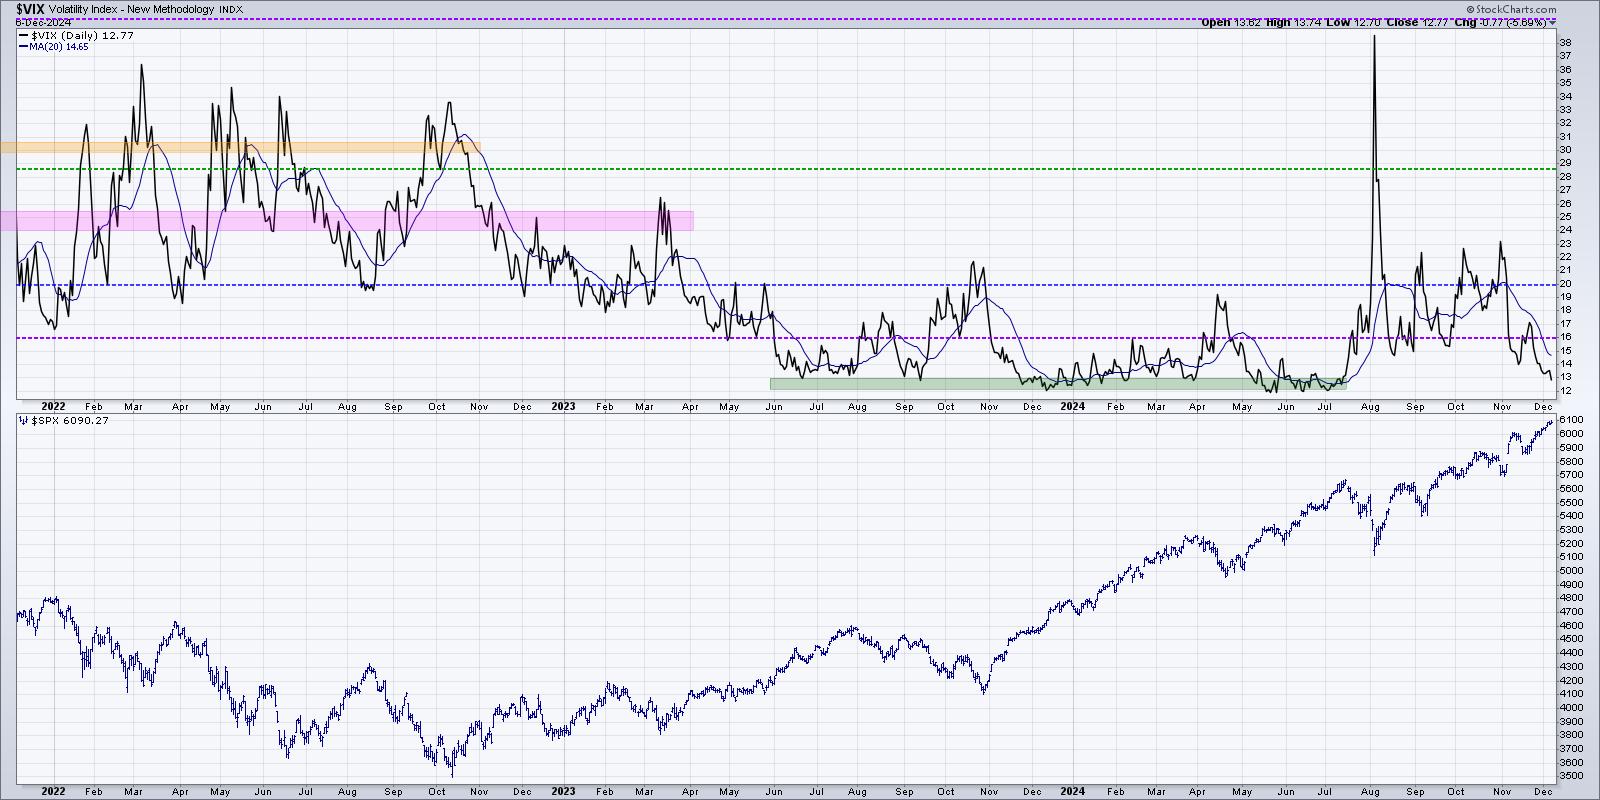
Now we can see that the VIX is back down to where it spent the second half of 2023 through July 2024. A volatility reading in the low teens suggests the market is “going up the escalator” and indicates the most likely path remains higher. And based on my own experience, as well as conversations I highlighted above, a spike in volatility is usually a dangerous sign no matter what the S&P 500 itself is doing at that particular point.
Looking for some last minute gift ideas for investors on your holiday list? Our Recommended Reading List could help you provide the gift of more mindful investing techniques! For those on your list that are not big on the financial markets but also super important to you, check out the “Personal Development” section at the bottom!
Comparing Volatility Between Stocks and Bonds
While many investors are familiar with the VIX to track volatility in the equity markets, far fewer are aware of the ICE MOVE index which tracks volatility for bonds. Perhaps the bond markets are signaling uncertainty that is not yet reflected in the movement of equities?
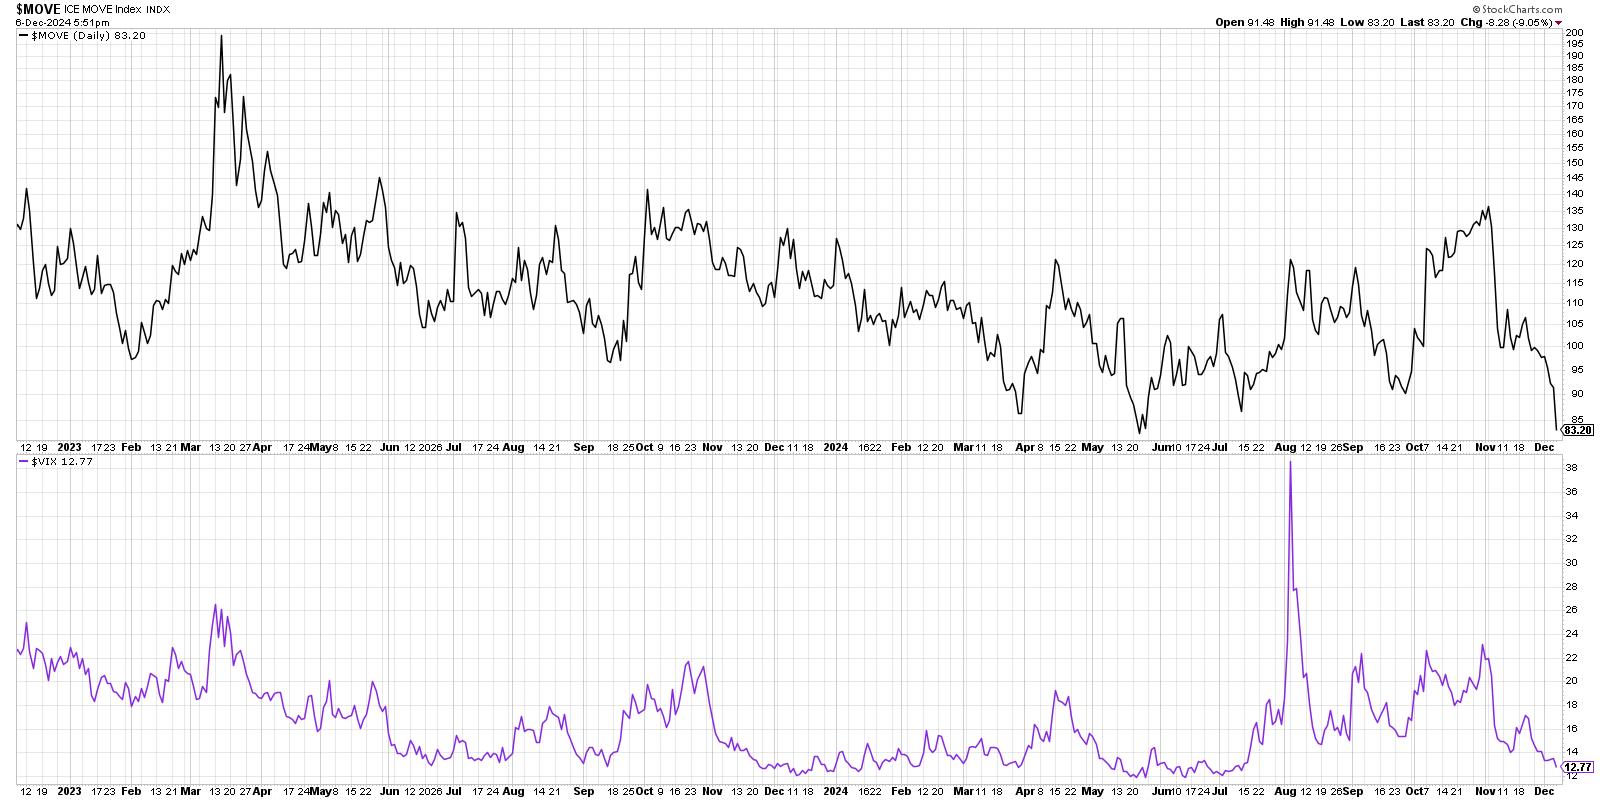
We can see a generally positive correlation between these two data series, although October saw the MOVE surging much higher than the VIX. But post-election, both the MOVE and the VIX have dropped in a very similar fashion. For now, both indexes reflect a low-volatility environment for their respective asset classes. This chart has a place of honor on my Market Misbehavior LIVE ChartList because I have often found the fixed income markets to serve as a leading indicator for stocks, especially when it comes to anticipating risk-off scenarios.
High Yield Spreads Remain Quite Narrow
We can also look at the high yield or “junk” bond market to determine how that particular area of the fixed income space is performing relative to stocks. I have found that high yield spreads, measuring the gap between yields on junk bonds versus risk-free Treasury bonds, often move in tandem with the VIX.
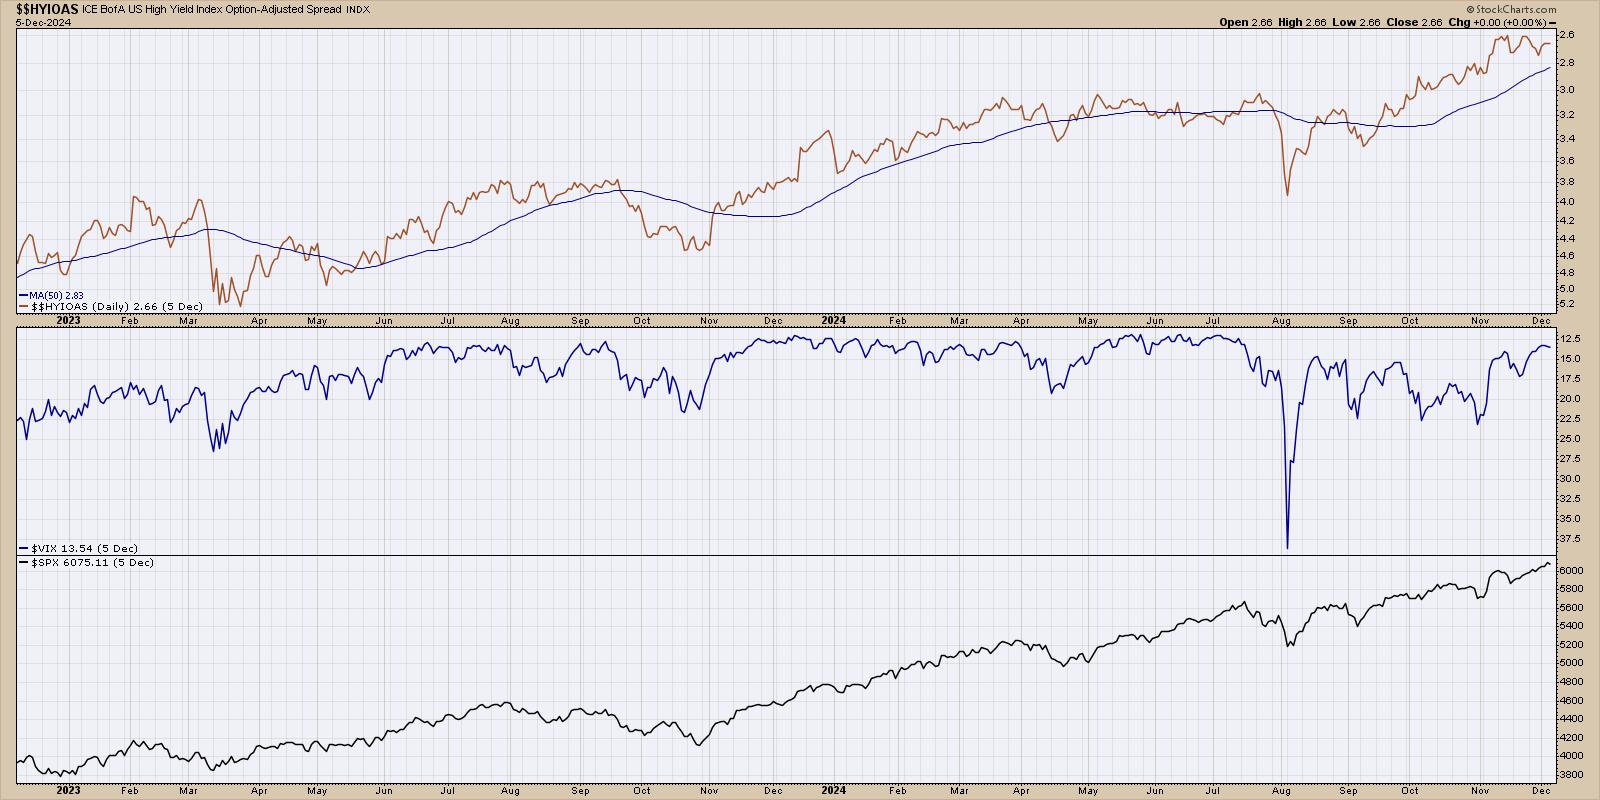
I have plotted the ICE BofA High Yield Index Option Adjusted Spread in the top panel using an inverted scale, followed by the VIX also on an inverted scale. The inverted scales are used here because of the traditional inverse relationship between these two data series and the S&P 500 index, shown at the bottom.
Note that high yield spreads are literally at their lowest levels in years, indicating that bond investors are perceiving a low-risk environment. So bond investors are saying low risk, equity investors are saying low risk, and that means this bull market is in great shape… for now.
While all three of these charts confirm the current low volatility uptrend phase for stocks, these charts will also likely provide us with clear signals when that low volatility bull phase is over. Using these charts as a guide, we can measure when the S&P 500 is perhaps ready to “take the elevator down” in a new correction phase!
RR#6,
Dave
PS- Ready to upgrade your investment process? Check out my free behavioral investing course!
David Keller, CMT
President and Chief Strategist
Sierra Alpha Research LLC
Disclaimer: This blog is for educational purposes only and should not be construed as financial advice. The ideas and strategies should never be used without first assessing your own personal and financial situation, or without consulting a financial professional.
The author does not have a position in mentioned securities at the time of publication. Any opinions expressed herein are solely those of the author and do not in any way represent the views or opinions of any other person or entity.


