 When the stock market hesitates to move in either direction, it becomes challenging to identify potential trading candidates. For this reason, it’s a good idea to have a checklist of items to go over during the trading day.
One item on my checklist is to run my SCTR (StockCharts Technical Rank, pronounced “scooter”) scan, which looks for stocks and exchange-traded funds (ETFs) with a SCTR rank above 76, 78, or 80. The scan results give you a good idea of which industries show technical strength. The scan is provided at the bottom of this article.
When I ran the scan on October 30 and sorted the results table by the Universe and SCTR columns, several regional banks made the list. This isn’t surprising, given that the Federal Reserve has started cutting interest rates and will likely make further cuts. The demand for consumer loans increases when interest rates are lower.
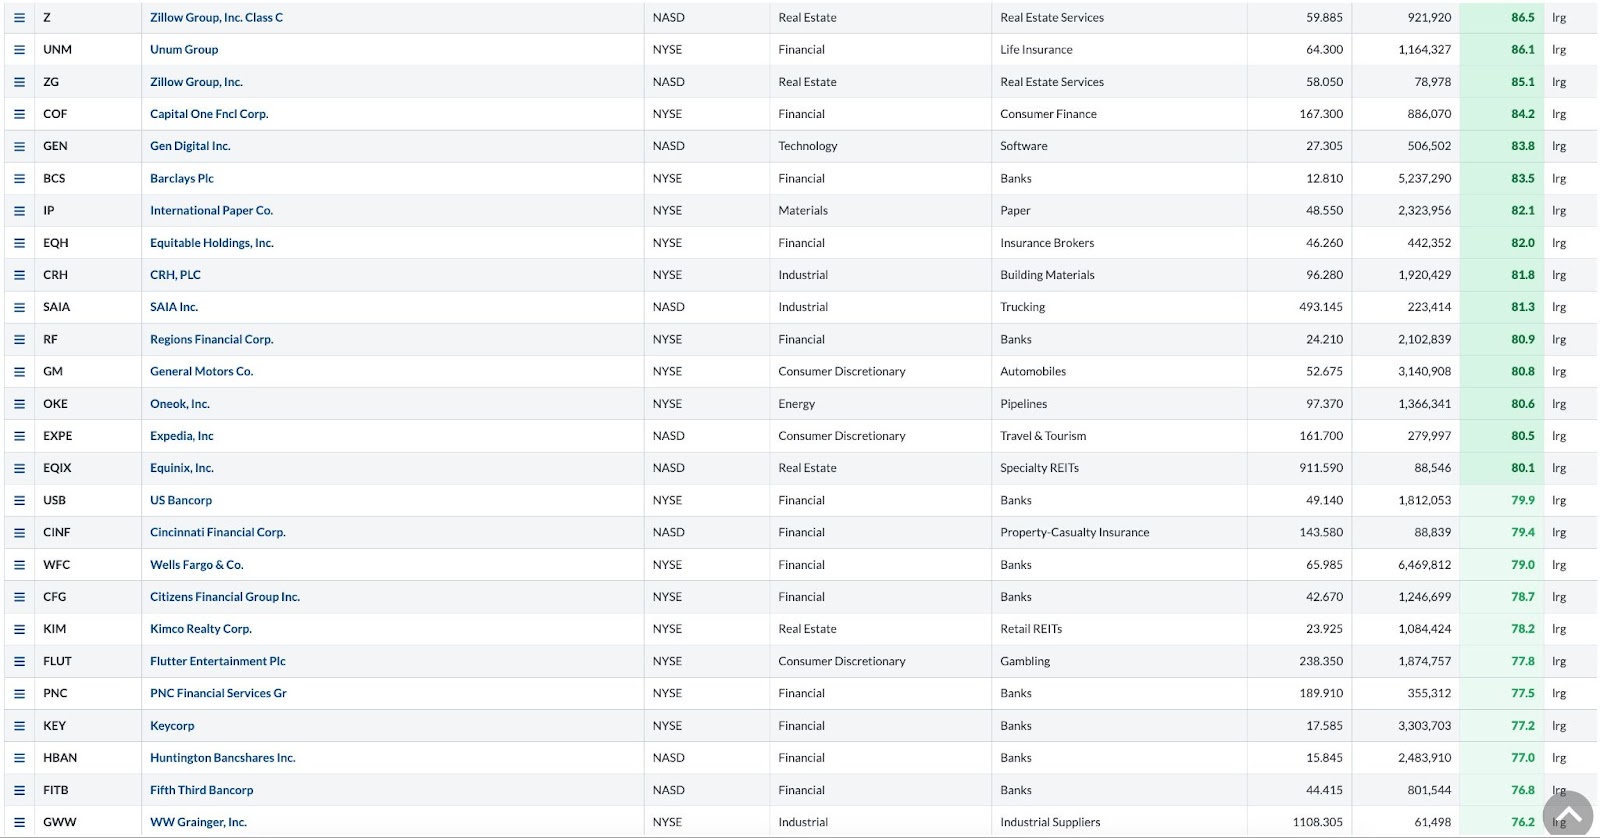
FIGURE 1. SCAN RESULTS, OCTOBER 30. Several regional banks were filtered in the scan.Image source: StockCharts.com. For educational purposes.
Naturally, I pulled up the chart of the SPDR S&P Regional Banking ETF (KRE). Since August, KRE has been in a gradual uptrend, accompanied by a rising S&P Financial Sector Bullish Percent Index ($BPFINA) and a high SCTR score.
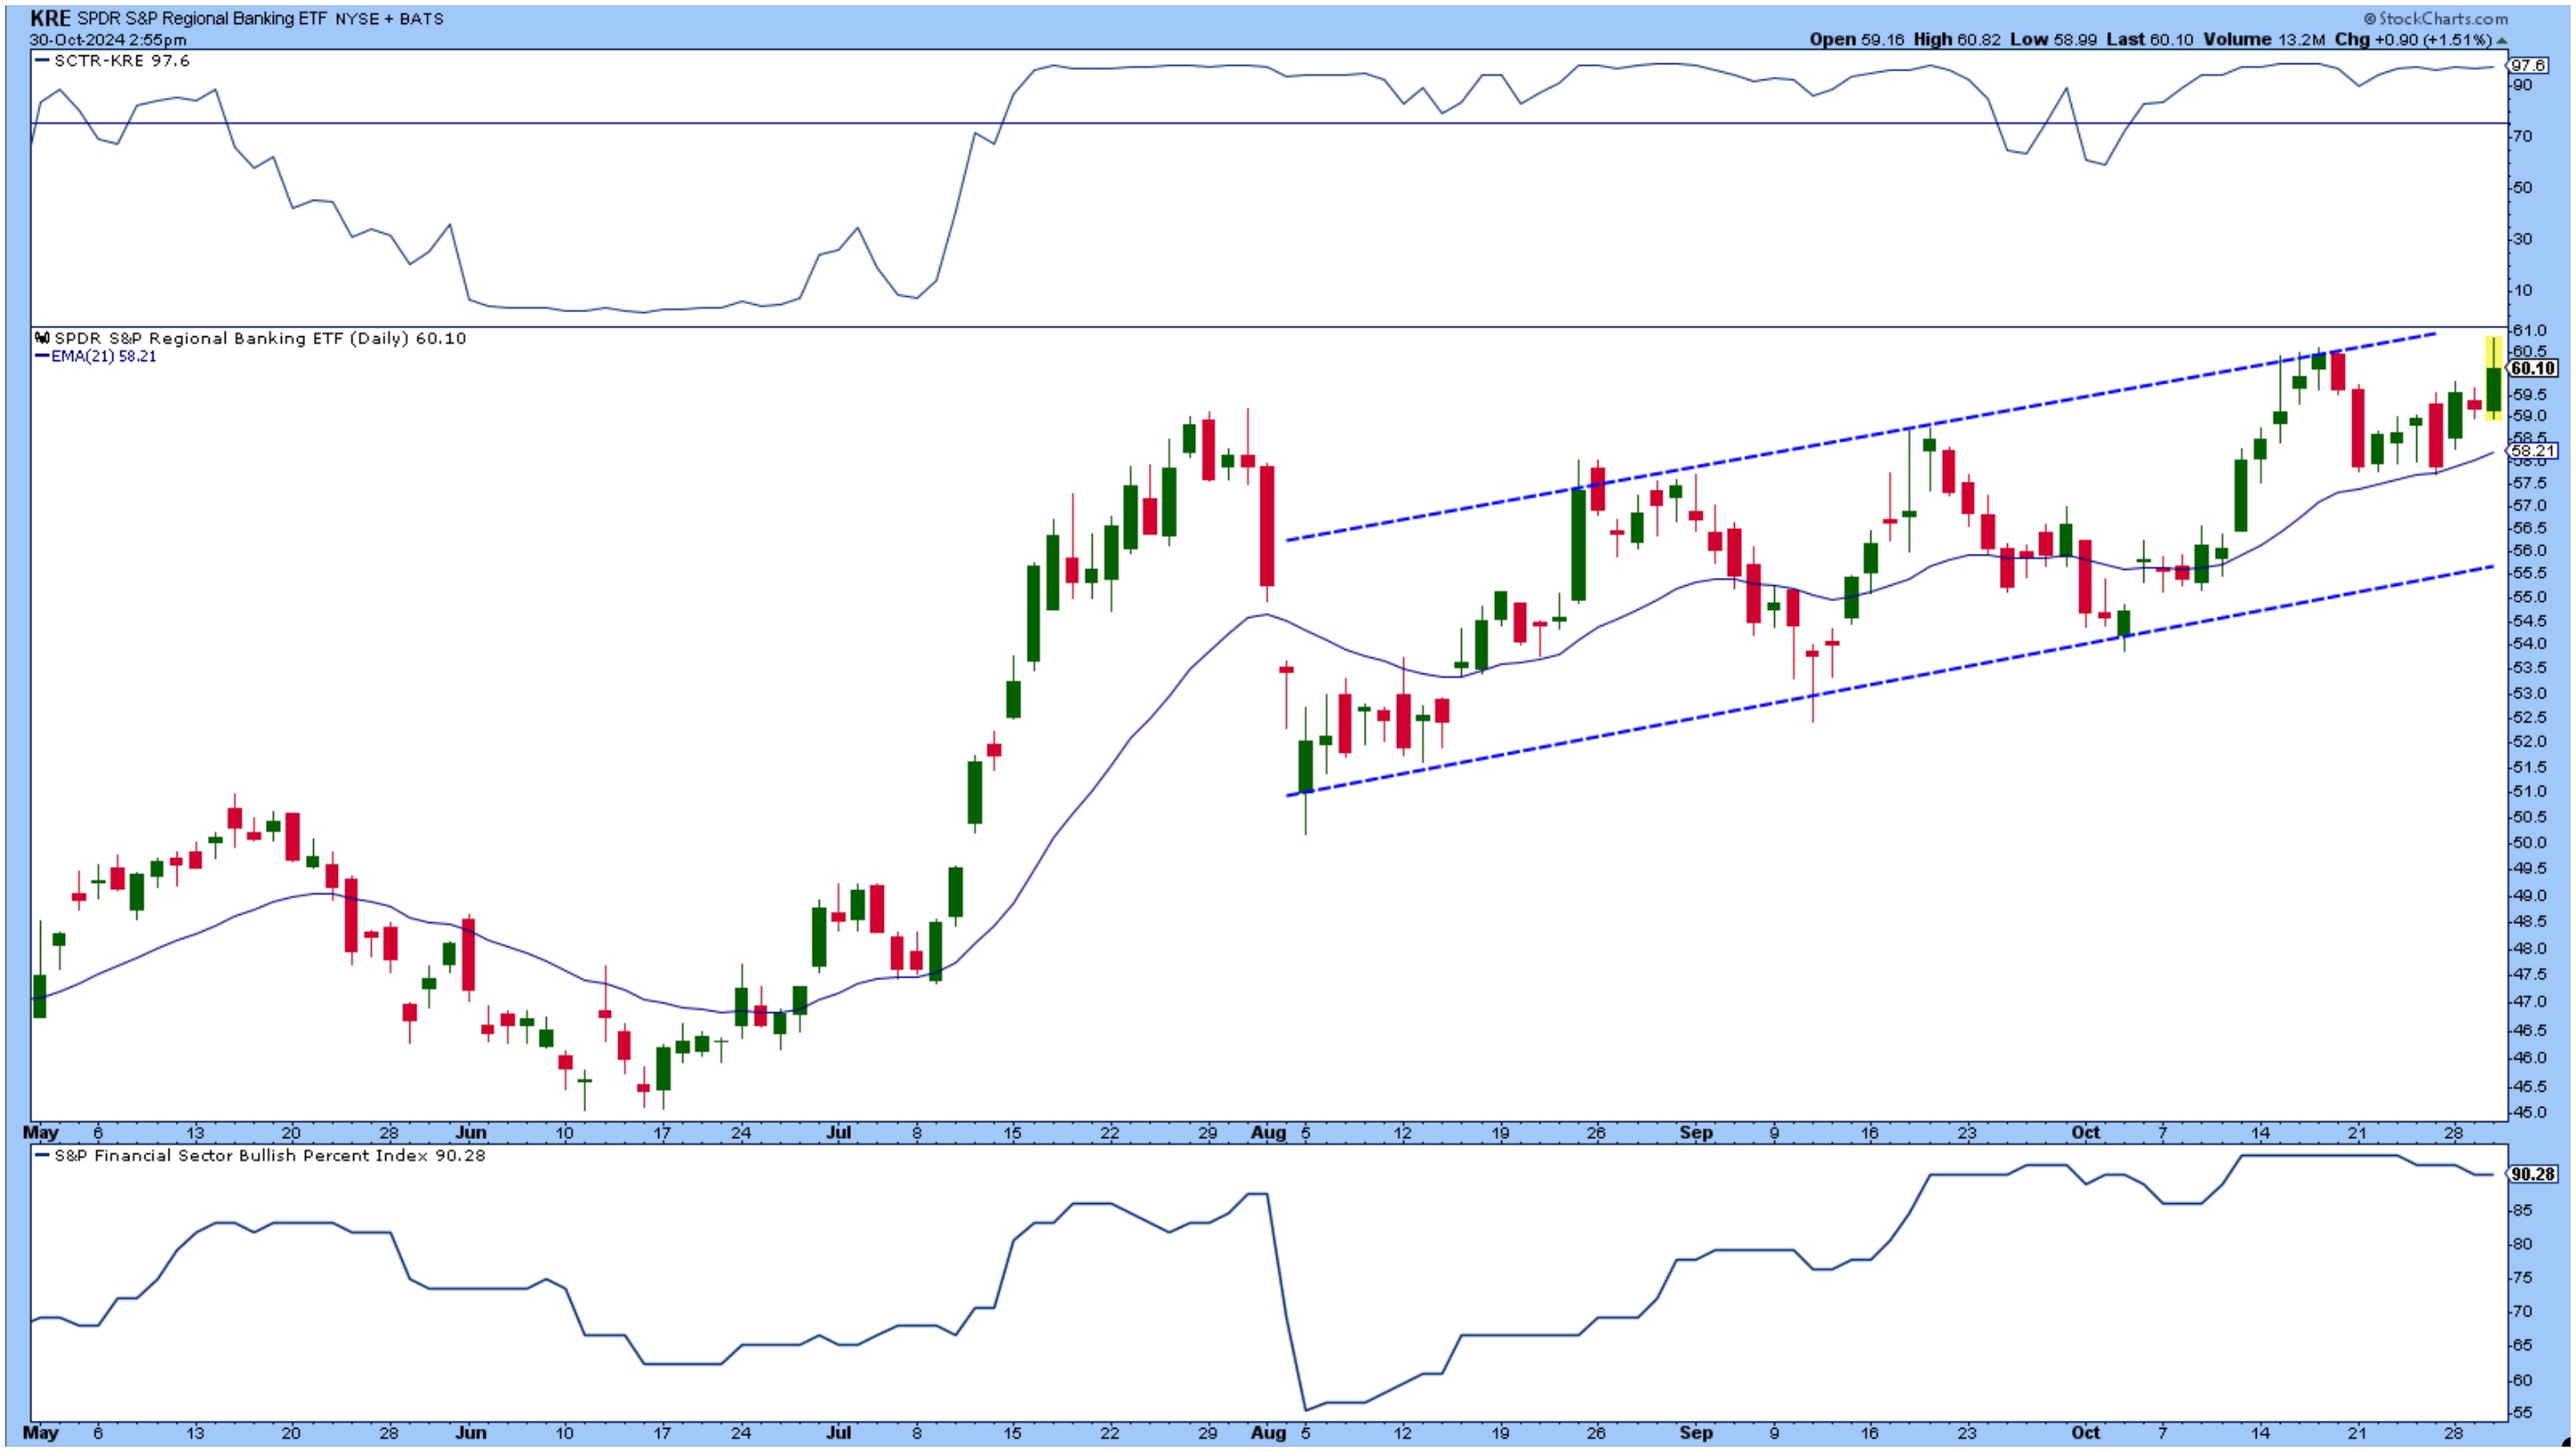
FIGURE 2. DAILY CHART OF KRE. The regional banks are moving within an uptrend channel and have a high SCTR score and BPI.Chart source: StockCharts.com. For educational purposes.
Looking back at the scan results, I can save them to a ChartList, analyze the regional banks, and decide which ones to keep and delete. I prefer to do this by viewing the charts in CandleGlance, which I have set up with moving averages and the On Balance Volume indicator. I look to see which stocks are trending up with an OBV that’s above its 20-day SMA.
Glancing at the candlestick charts, the stocks that stand out are as follows:
- Barclays Plc (BCS)
- Cincinnati Financial Corp. (CINF)
- Fifth Third Bancorp (FITB)
- Keycorp (KEY)
- PNC Financial Services (PNC)
- US Bancorp (USB)
I transferred these symbols to my “watchlists” ChartList, which is where I have all stocks and ETFs that are in consideration. If you haven’t done so, install the StockCharts ChartList Framework to organize your ChartLists.
Analyzing Regional Banks
The next step involves analyzing each of these charts in more detail. Which ones have momentum behind them to make them trend higher? The moving average convergence/divergence (MACD) and the relative strength index (RSI) help confirm the momentum. Of the six, the three that stand out are KEY, PNC, and USB. Let’s look at these charts.
Keycorp (KEY)
The momentum looks like it’s slowing in Key Bank’s stock price (see daily chart below), which could be because it’s at or close to a resistance level.
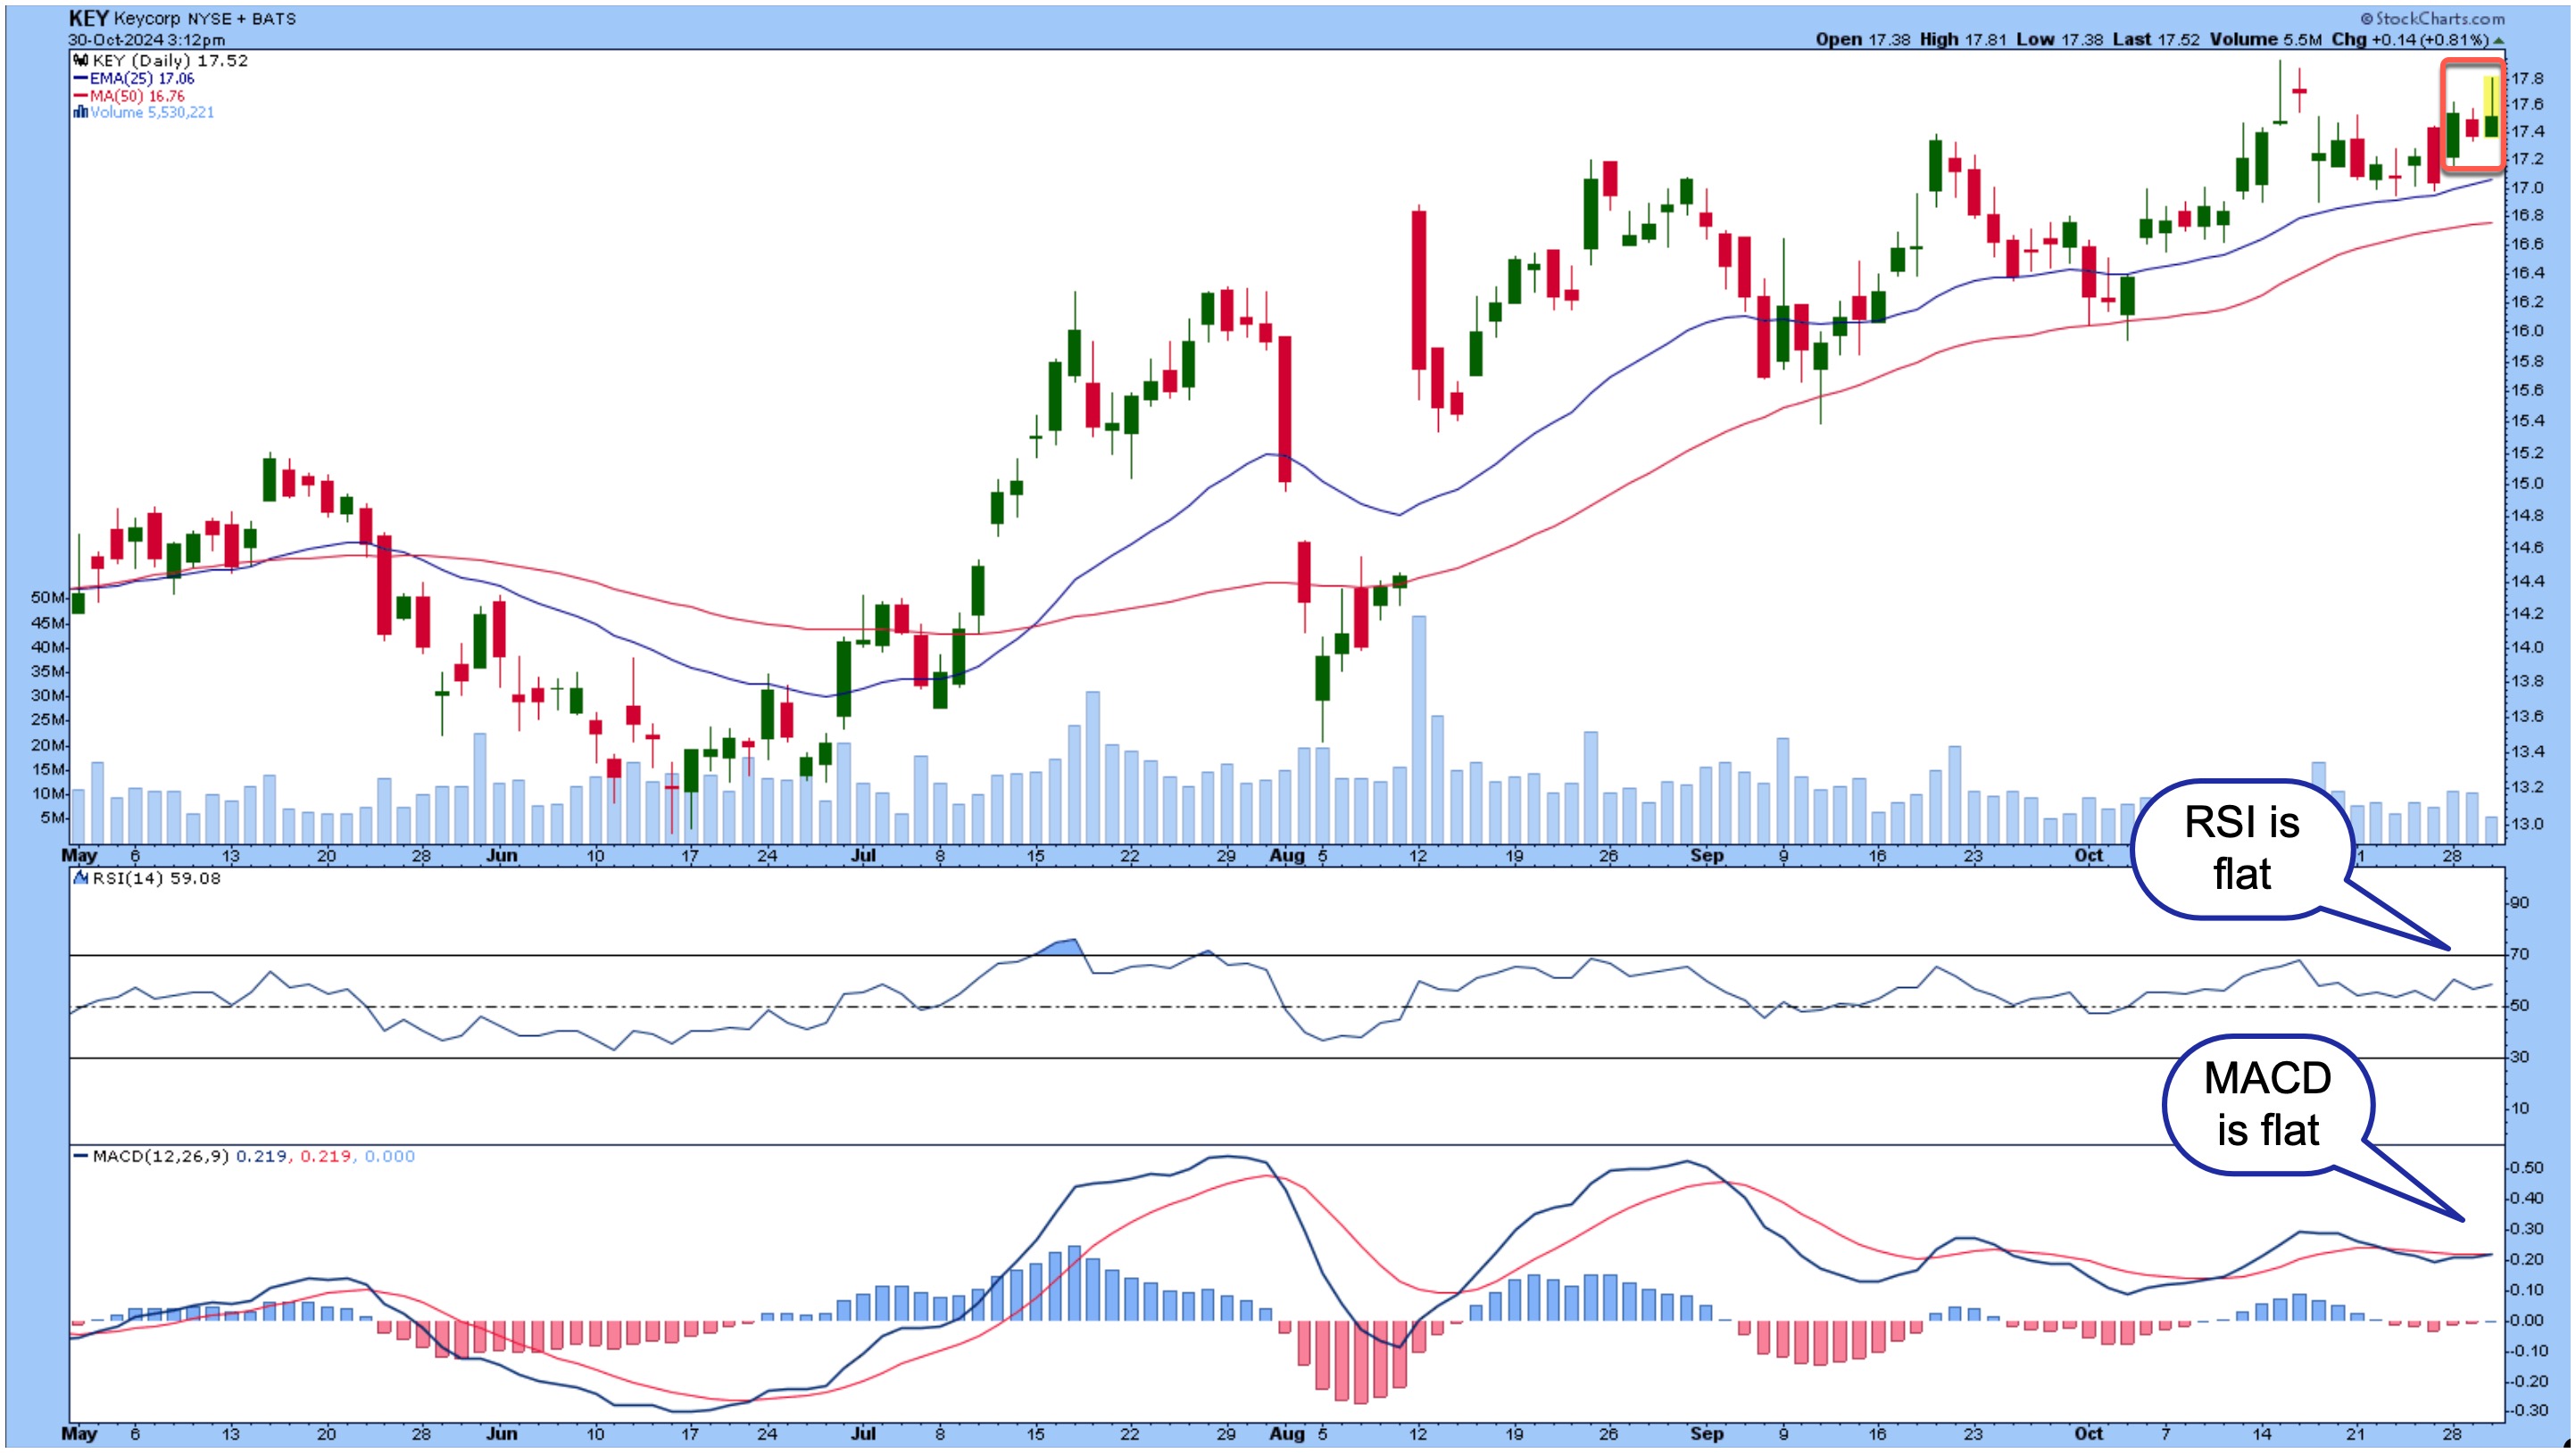 FIGURE 3. DAILY CHART OF KEY BANK’S STOCK PRICE. KEY is in an uptrend although the momentum is slowing down. The last three bars, RSI, and MACD are showing sideways movement.Chart source: StockCharts.com. For educational purposes.
Looking at a three-year timeframe, you’ll see that the stock price is close to the February 2023 high (not shown here). The last three bars show a harami followed by an inverted hammer. So, there could be a slight pullback here, at least to its 25-day exponential moving average.
The RSI and MACD confirm the slowdown in momentum. If KEY pulls back and reverses with increasing momentum, I would consider entering a position. KEY’s all-time high is $23.44, so the stock has room for upside movement.
PNC Financial (PNC)
PNC’s chart is similar to that of KEY. The stock price is trending higher but momentum is slow at the moment. Trading volume has been relatively low in the last few days. If the RSI and MACD indicate increasing momentum and volume picks up, it will alert me to consider adding PNC to my portfolio.
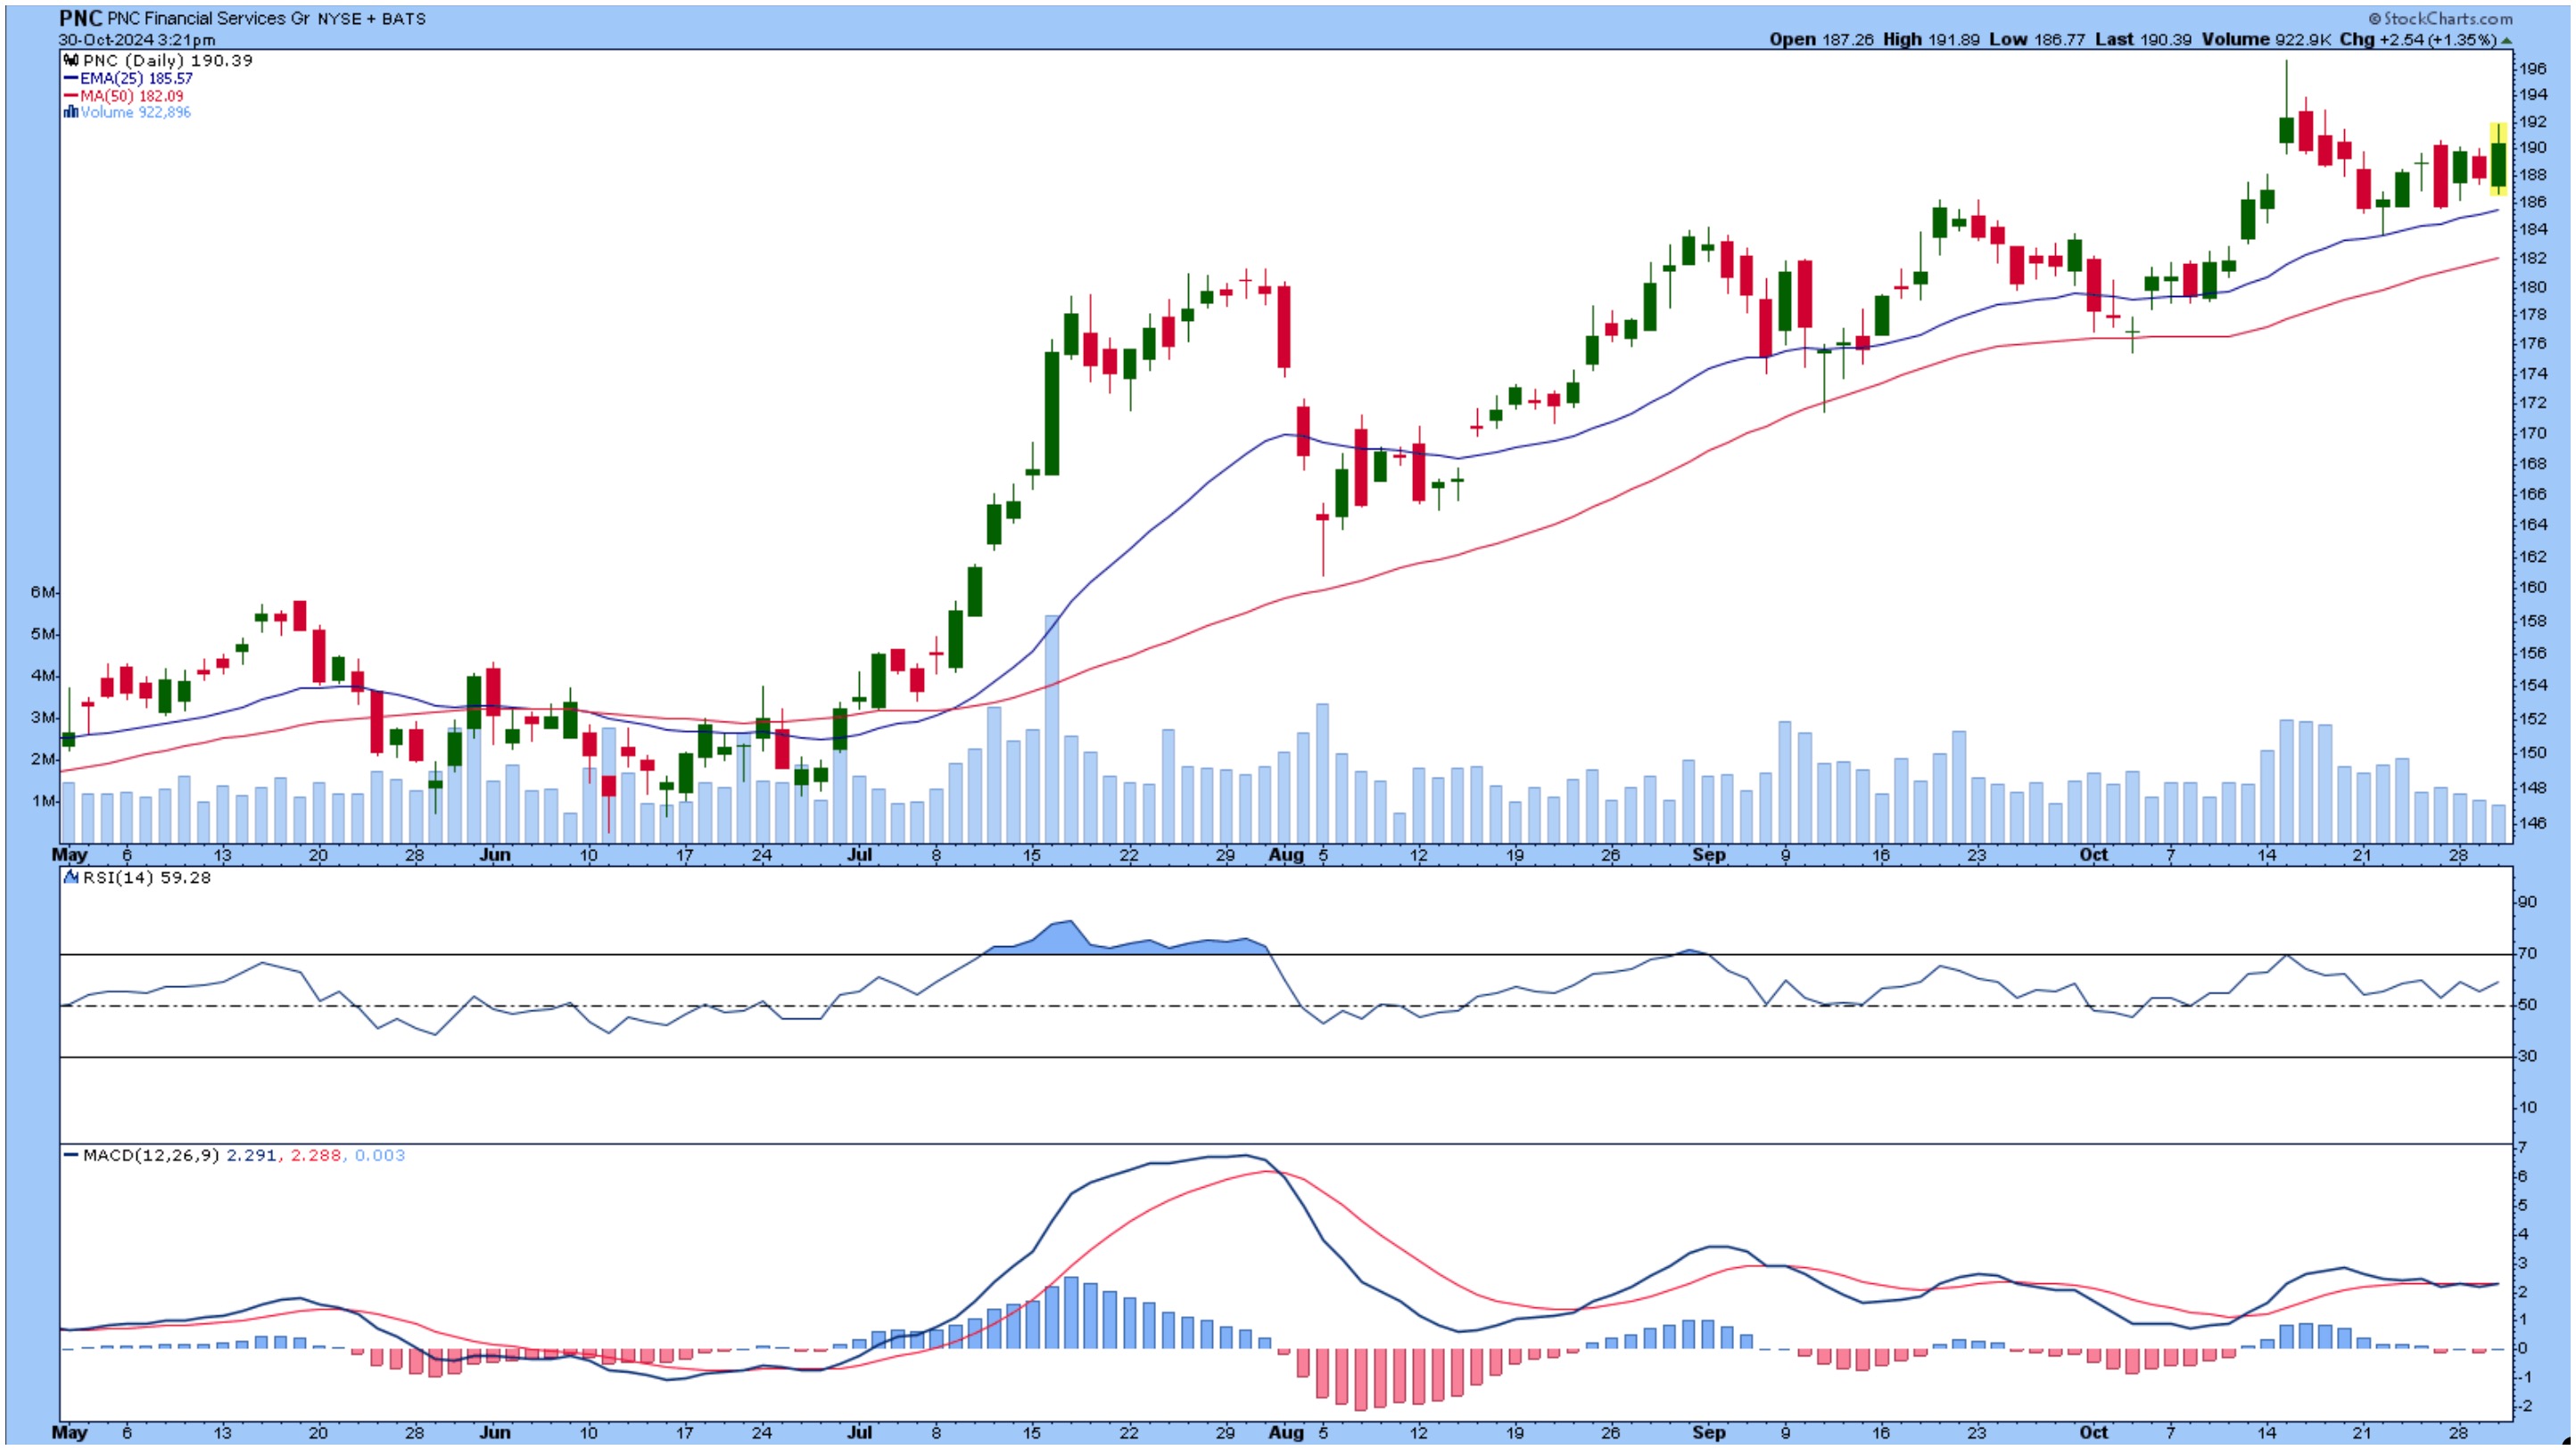
FIGURE 4. DAILY CHART OF PNC BANK STOCK PRICE. PNC’s stock price is trending higher but trading volume is relatively low. The RSI and MACD are indicating slow momentum.Chart source: StockCharts.com. For educational purposes.
PNC’s all-time high is $202.80, so the stock price has the potential to move higher. It’ll first have to break out of its sideways move.
US Bancorp (USB)
Of the three, US Bank’s stock price has the most chop. The 25-day EMA was erratic, so it was removed from this chart. The 50-day SMA is a smoother measure of the overall trend.
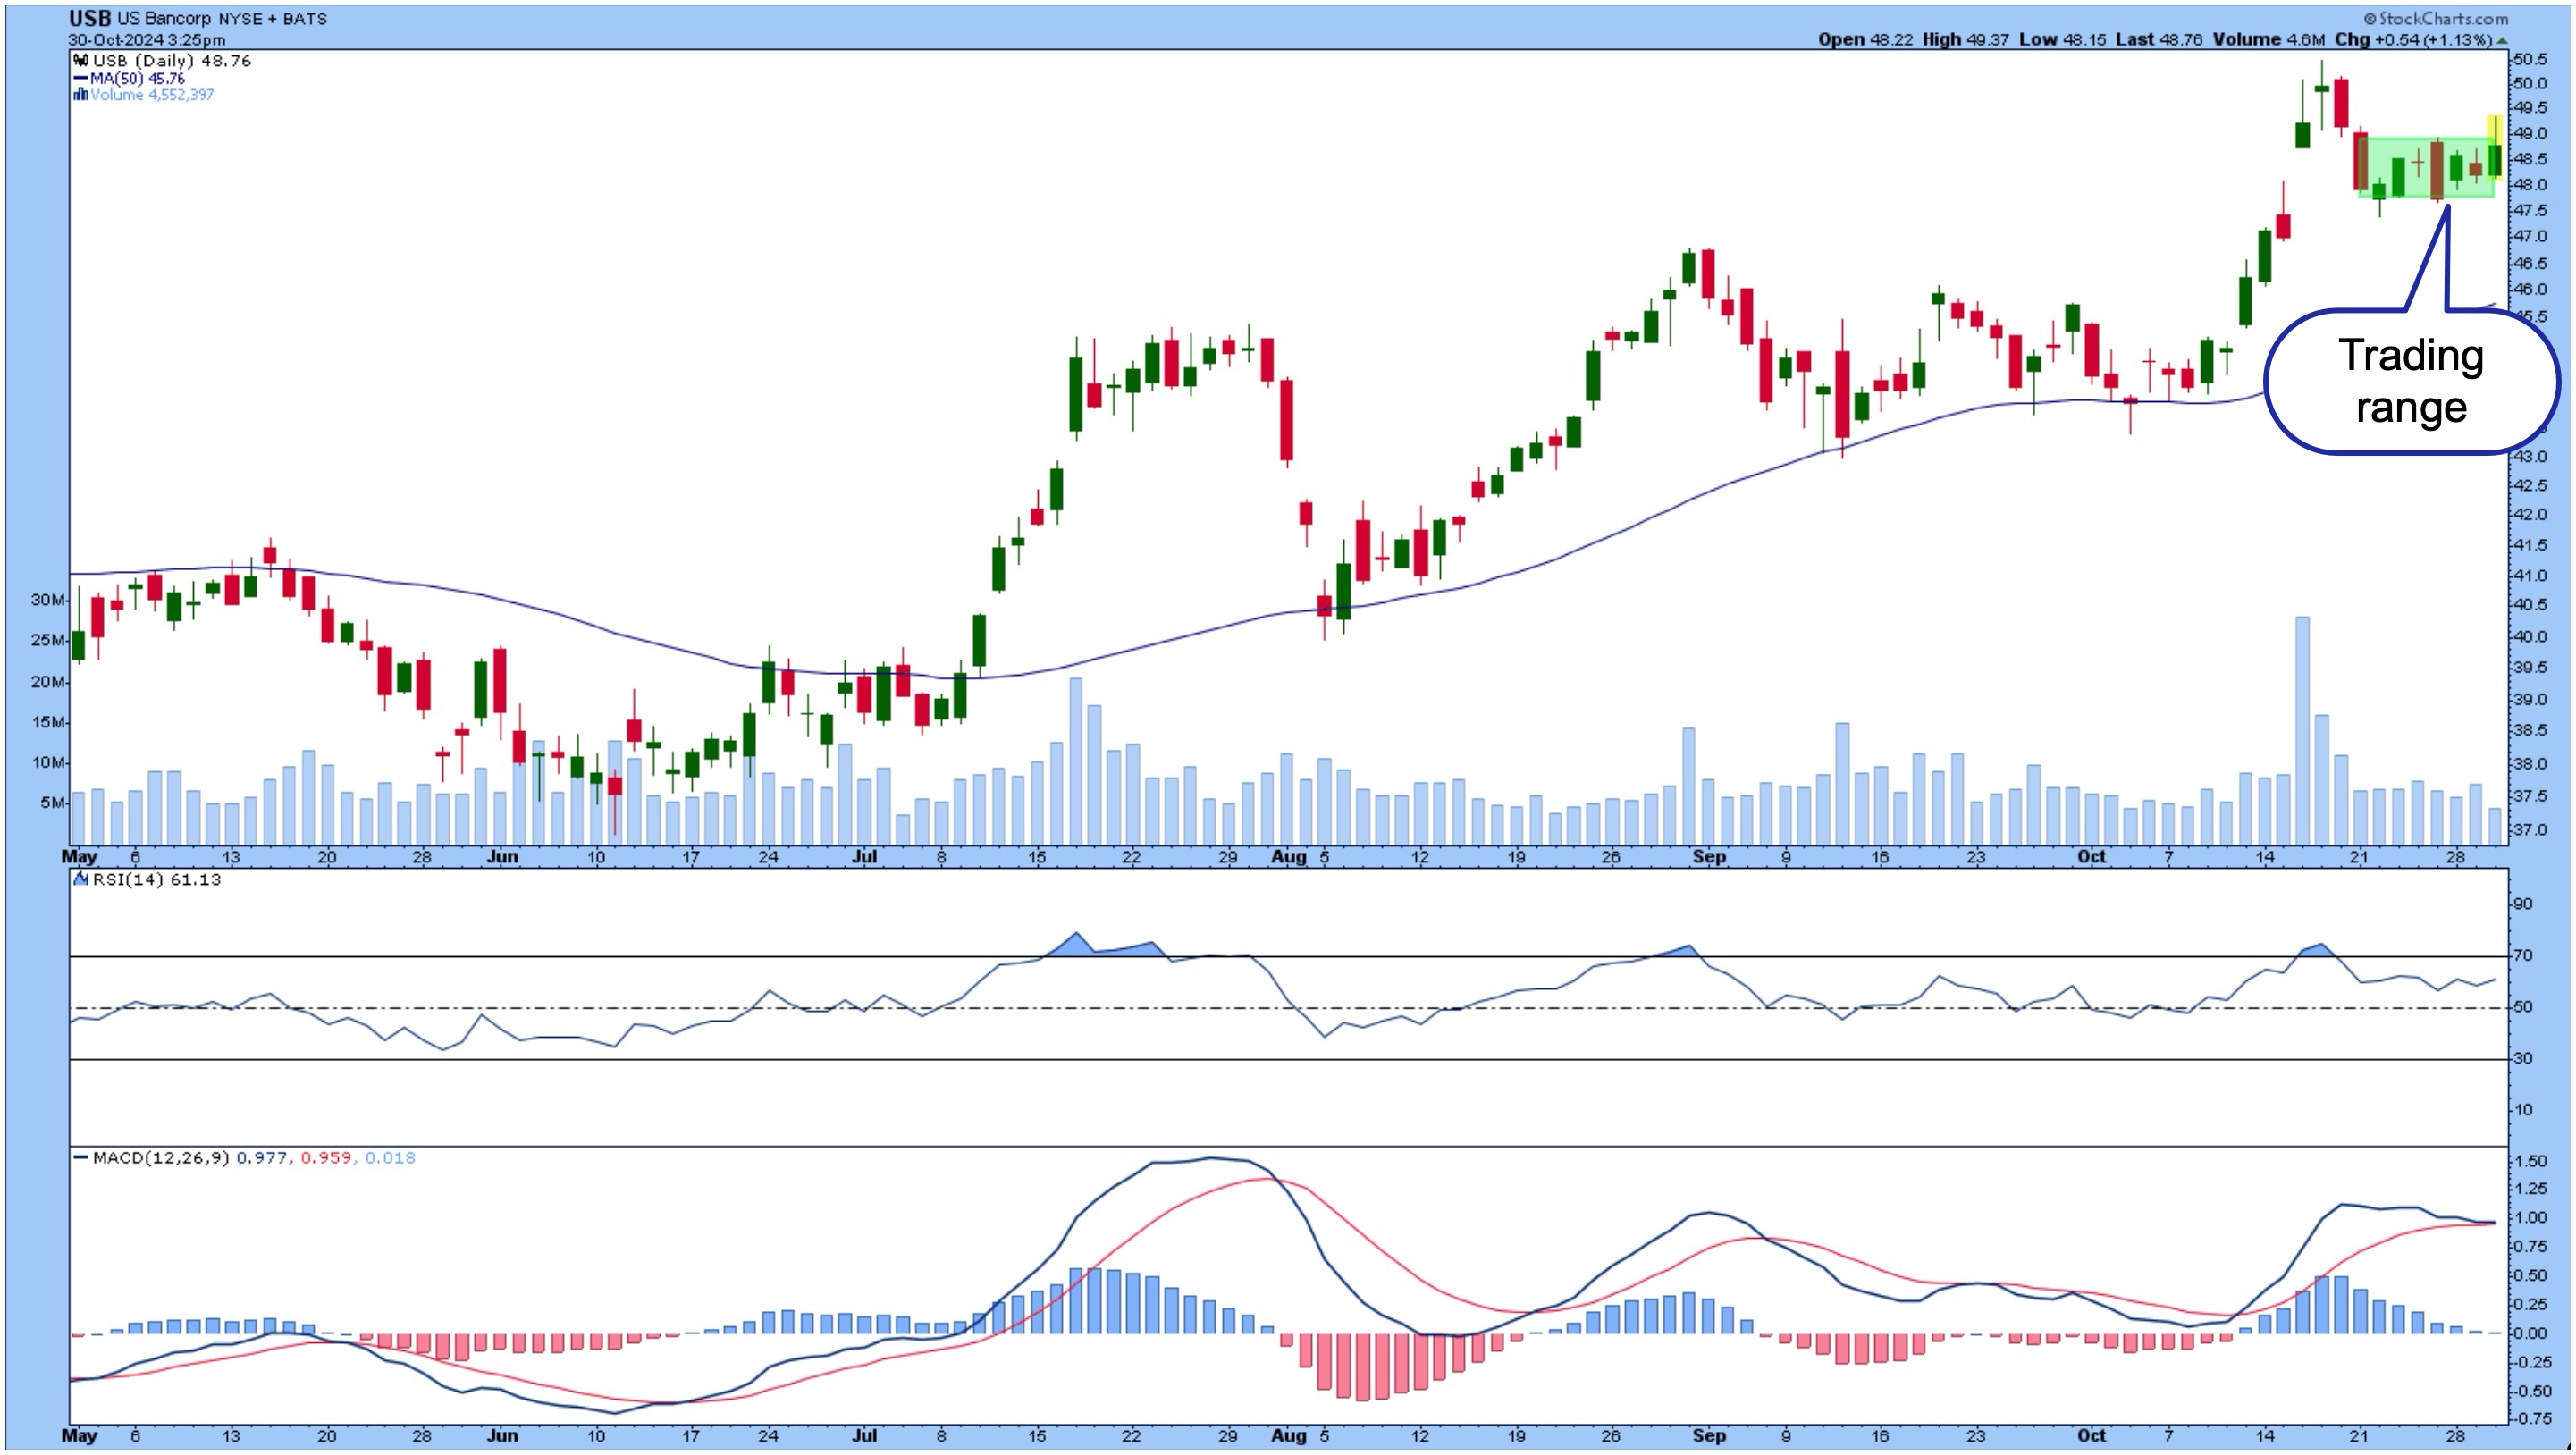
FIGURE 5. DAILY CHART OF US BANK STOCK. USB is within a trading range. An upside breakout with above-average volume and a rising RSI and MACD crossover would be an indication of an upward-sloping trend.Chart source: StockCharts.com. For educational purposes.
KRE must break out from its sideways trading range before considering a long entry. Volume is relatively low, the RSI is moving sideways, and the MACD indicates a slowdown in momentum.
The Bottom Line
The sideways movement seen in the charts that we discussed here reflects the sentiment of the overall market. Earnings and economic data aren’t moving the market much, and trading volume is relatively low. There’s an election and a Fed meeting coming up. The Fed decision will likely have an impact on the price action of regional bank stocks. Does it mean you have to wait until November 7 to make your trading decisions? Patience is key, but if you see an upside breakout with strong momentum that’s convincing, you may have an opportunity to get in early on an upside move.
The SCTR Scan
[country is US] and [sma(20,volume) > 100000] and [[SCTR.us.etf x 76] or [SCTR.large x 76] or [SCTR.us.etf x 78] or [SCTR.large x 78] or [SCTR.us.etf x 80] or [SCTR.large x 80]]

Disclaimer: This blog is for educational purposes only and should not be construed as financial advice. The ideas and strategies should never be used without first assessing your own personal and financial situation, or without consulting a financial professional.


