 As of Tuesday, the CME’s FedWatch Tool gave a 67% chance of a 50 basis-point rate cut—way up from the 25-point cut everyone was betting on just days ago. A rate cut could send the price of gold soaring past its all-time high, so investors and goldbugs are on edge, waiting for the results of this week’s FOMC meeting.
Suppose the expected rate cuts do take place and gold price jumps. How high can the yellow metal soar? The tricky part is that these levels have no historical prices to gauge such a move.
Fundamental analysts are all over the place with their projections, leaving you more confused than informed. But don’t worry; there are technical tools you can use to gauge potential upside and keep an eye on any downside risks.
Using the ACP Fibonacci Extension Tool
Pull up a SPDR Gold Shares ETF (GLD) chart in StockChartsACP. Using the annotation tool, draw a Fibonacci Retracement line from the February low to the May high. In your settings, click on the extensions to get price projections beyond the 0% to 100% measure. Also, be sure to check the extension levels you want to see (as shown below):
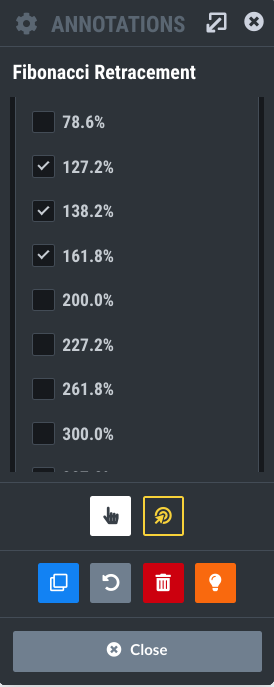
FIGURE 1: FIBONACCI RETRACEMENT PARAMETERS. If you want Fib extensions, check the levels you want to see.Image source: StockChartsACP. For educational purposes.
This is what the chart should look like (see weekly chart of GLD below).
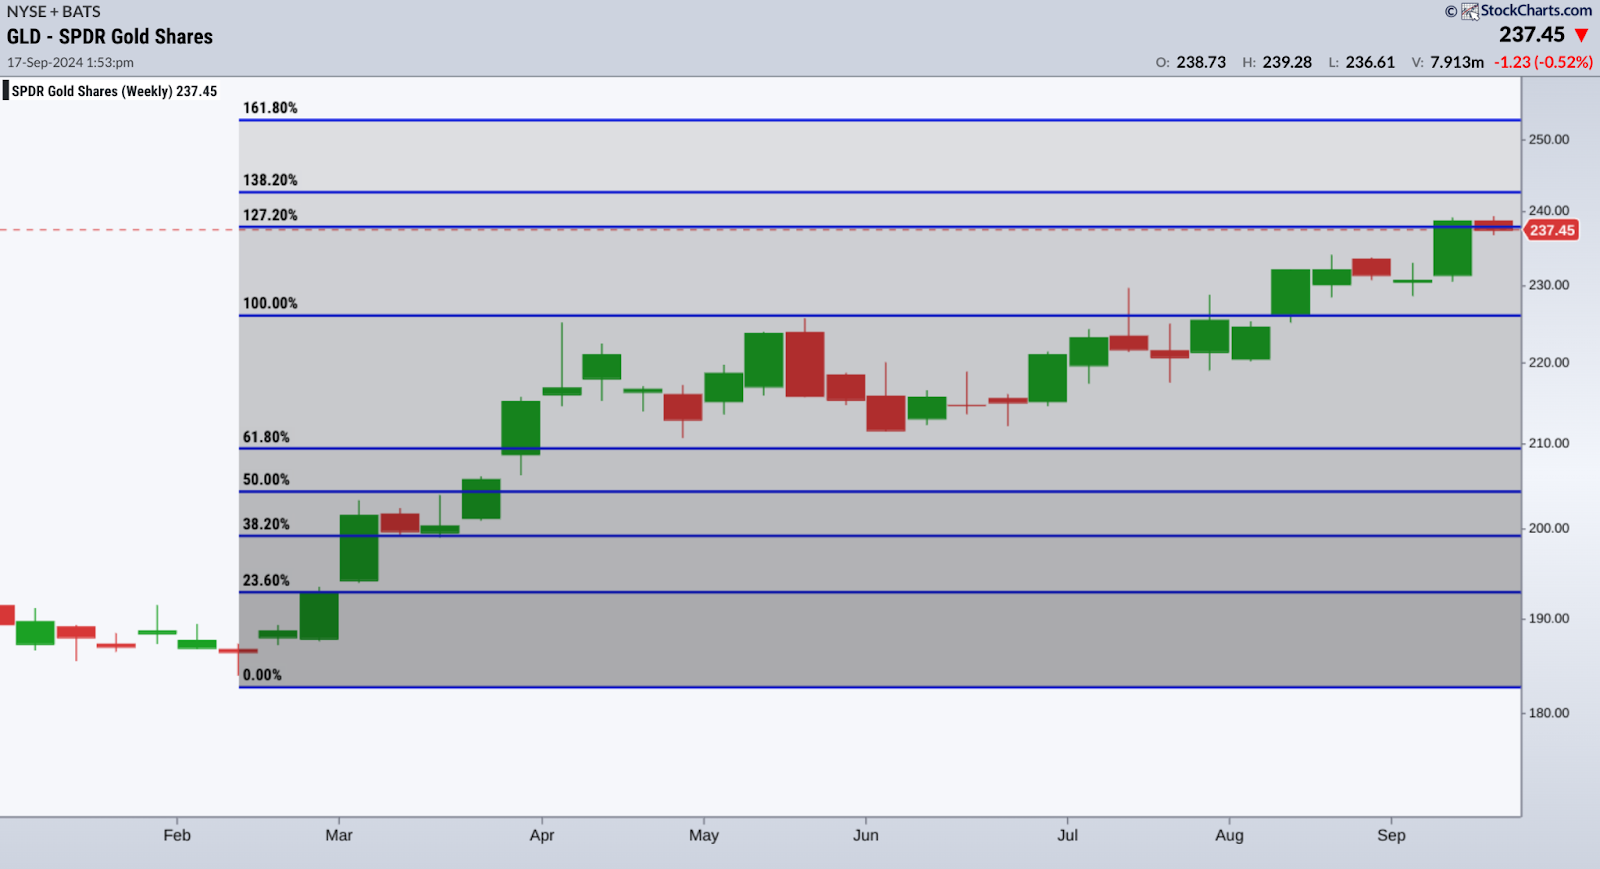
FIGURE 2: WEEKLY GOLD PRICE CHART. Setting your extension levels will help you get price projections for GLD.Chart source: StockChartsACP. For educational purposes.
Here’s what to keep an eye on:
- The 127.20% extension has already been met as profit-takers began selling their position.
- If GLD continues to move higher, the next upside targets are $242.50 (138.20% Fib extension) and $252.70 (161.80% Fib extension).
These are your two intermediate-term targets. Anything above that is possible, but you’ll need to check the fundamentals and technicals before making new projections.
But what if prices dip? How do you measure the pullback to decide if it’s a good time to jump in or if it’s headed for a bigger drop—meaning you should wait it out?
To answer that, let’s shift to a daily SharpCharts view of GLD.
Using Quadrant Lines to Gauge a Pullback
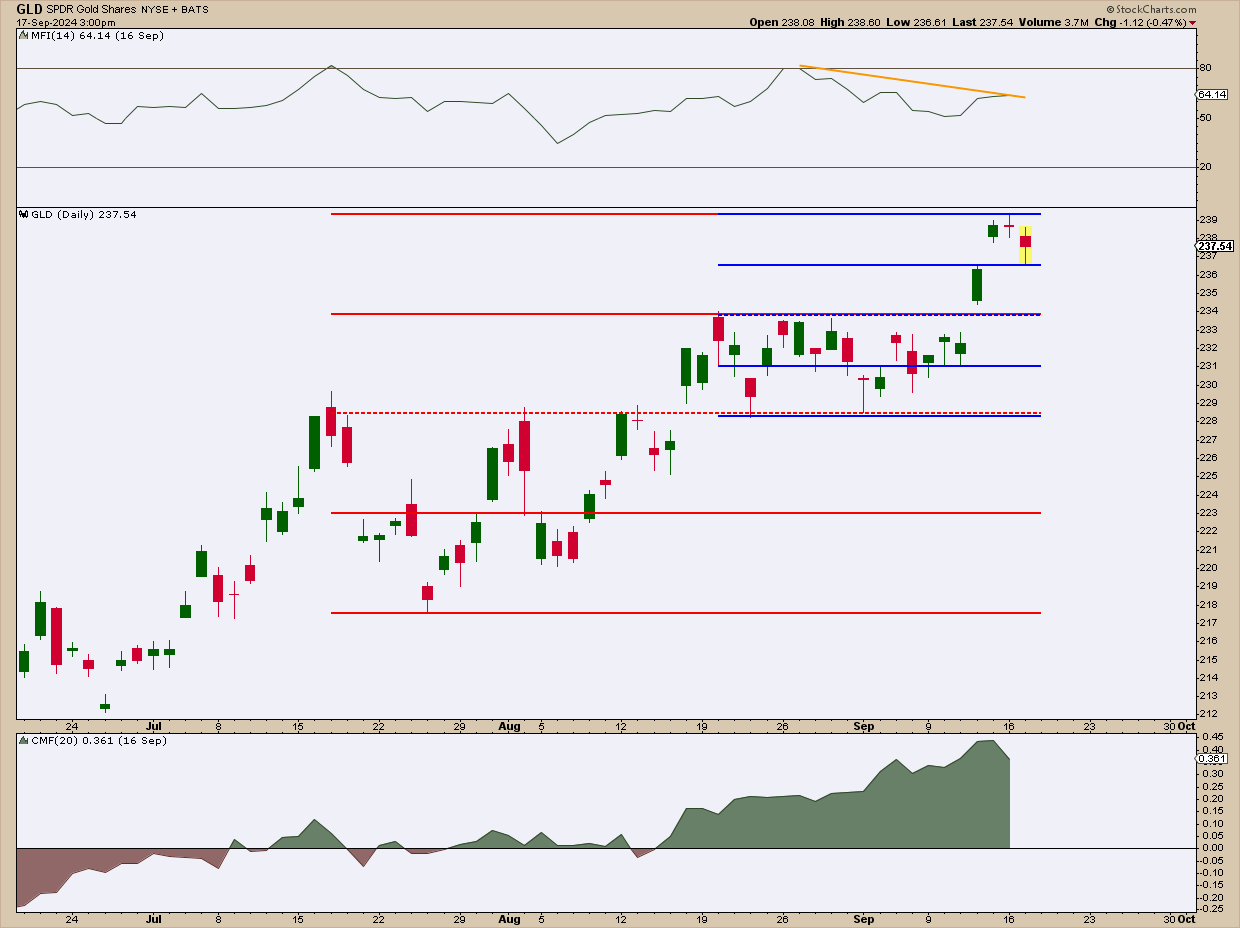
FIGURE 3. DAILY GOLD PRICE CHART. Note the short-term and intermediate-term quadrant lines. However, don’t ignore the divergence between price movement and the Money Flow Index (MFI) in the top panel.Chart source: StockChartsACP. For educational purposes.
The chart has two types of Quadrant Lines:
- The blue Quadrant Lines measure the short-term price action.
- The red Quadrant Lines measure the intermediate-term price action.
Not familiar with Quadrant Lines? In a nutshell, Quadrant Lines break down the high-low range into four sections. Think of them as a visual guide to see where prices stand within that range. Like Fibonacci retracements, they can spot potential reversals—a shallow 25% pullback might show strength, while a deeper 75% retracement could signal a potential reversal.
With this in mind, note the following:
- Based on the short-term lines, the price of GLD can pull back to $231 without messing up the short-term trend, but, if price breaks below $228.50, that’s a different (and bearish) story.
- The intermediate-term uptrend is still intact as long as GLD stays above $223, but, if it falls below $218, that trend’s out the window, too.
In terms of momentum:
- Buying pressure continues to rise, based on the Chaikin Money Flow (CMF).
- However, if you look at the Money Flow Index (MFI), which functions like a volume-weighted RSI, note the divergence between the MFI line and the price of GLD; this indicates the likelihood of a continued pullback (so watch those quadrant lines!).
At the Close
Predicting the price of gold beyond all-time highs is tough, but, if fundamental tools fall short, technicals can offer clarity—whether prices keep climbing or take a dip. As far as gold prices are concerned, watch GLD’s next moves closely and use Fibonacci Extensions and Quadrant Lines to help inform your setup.

Disclaimer: This blog is for educational purposes only and should not be construed as financial advice. The ideas and strategies should never be used without first assessing your own personal and financial situation, or without consulting a financial professional.


