 One of several effective StockCharts tools you can use to spot potential trading or investing opportunities is to check the New Highs panel in Your Dashboard. This feature highlights stocks hitting new highs—from one-month peaks to 52-week or all-time records—giving you a peek at where Wall Street’s capital may be flowing.
On Monday morning, the one-month new high list top 10 gave us three transportation stocks: Carnival Corp (CCL), Delta Air Lines (DAL), and United Airlines (UAL). As you can see below, Carnival, under the Consumer Discretionary sector, occupies the top spot.
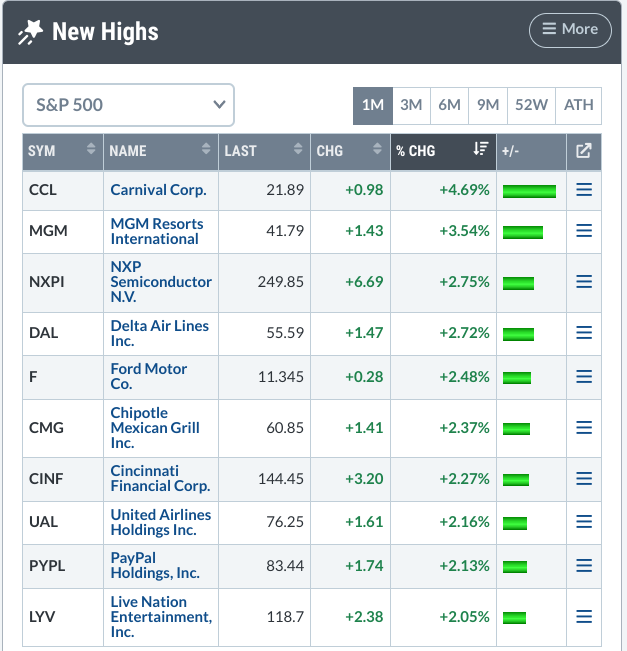
FIGURE 1: NEW HIGHS FOR MONDAY, OCTOBER 28, 2024. We got a ship and two airlines. Which one, if any, might be more tradable or investment-worthy from a technical perspective?Image source: StockCharts.com. For educational purposes.
If the transportation industry seems like a suitable prospect for your portfolio, one of the first things you’ll want to do is compare the charts and drill down on the technicals. Let’s start with a PerfCharts view for a quick 200-day comparison of all three stocks.
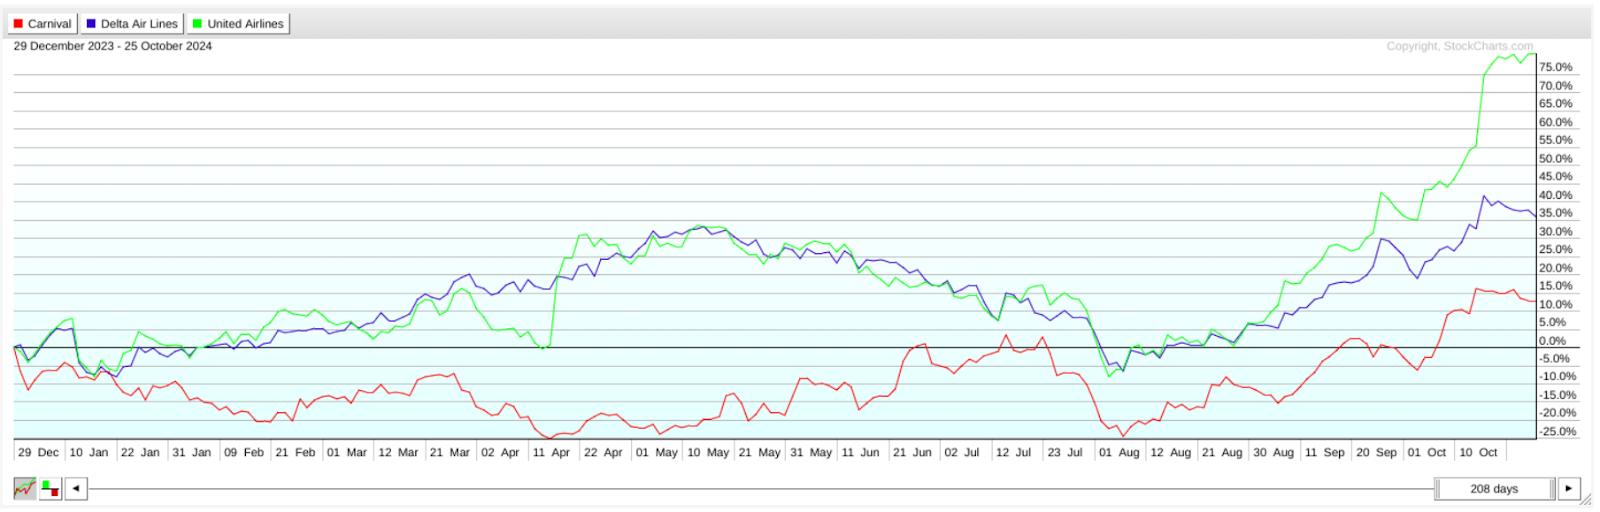
FIGURE 2. PERFCHARTS OF CARNIVAL CORP, DELTA AIR LINES, AND UNITED AIRLINES STOCK. United Airlines took off and is now sky-high, with Delta following below while Carnival’s at the bottom with its tide rising.Chart source: StockCharts.com. For educational purposes.
With UAL clearly outpacing the other two, it makes you wonder whether the airline has enough fuel to gain more altitude or whether its trajectory is a little too vertical. Carnival, on the other hand, is the underperformer. But does that mean it has more upside to cover, and are we witnessing the beginning of a much larger uptrend?
Note: We’ll look at weekly charts because this time frame provides the clearest key levels for each stock.
Let’s start with a weekly chart of CCL.

FIGURE 3. WEEKLY CHART OF CARNIVAL CORP STOCK. Note the multiple levels of resistance overhead.Chart source: StockCharts.com. For educational purposes.
A couple of things to note:
- CCL’s StockChartsTechnicalRank (SCTR) score has hit or crossed the bullish 90 mark several times in the past four years, but it hasn’t stayed there for long. Each time it peaks, the score drops within a few months, signaling that the stock struggles to maintain technical strength for extended periods.
- CCL has four resistance levels up ahead, marked by the dotted magenta lines. If you happen to be long the stock, expect heavier profit-taking and selling pressure at each consecutive resistance level all the way up to $31.
- The stock has broken out of a long-term ascending triangle pattern, which is generally bullish. However, according to the On Balance Volume (OBV), the buying/selling momentum is narrowing as prices rise, signaling not only an intensified state of indecision but also a divergence between price and momentum.
At this point, it’s a wait-and-see, and if price pulls back, keep an eye on the top of the triangle pattern near $19.75 to see if price bounces and what the momentum looks like at that point, specifically on a daily chart. I’m not zooming into the daily chart because the key levels it will give are similar to what you can see on the weekly.
So, how might Carnival Corp. stock perform technically against UAL, which, in the PerfCharts, is outperforming CCL and DAL? Let’s take a look at UAL’s weekly chart.
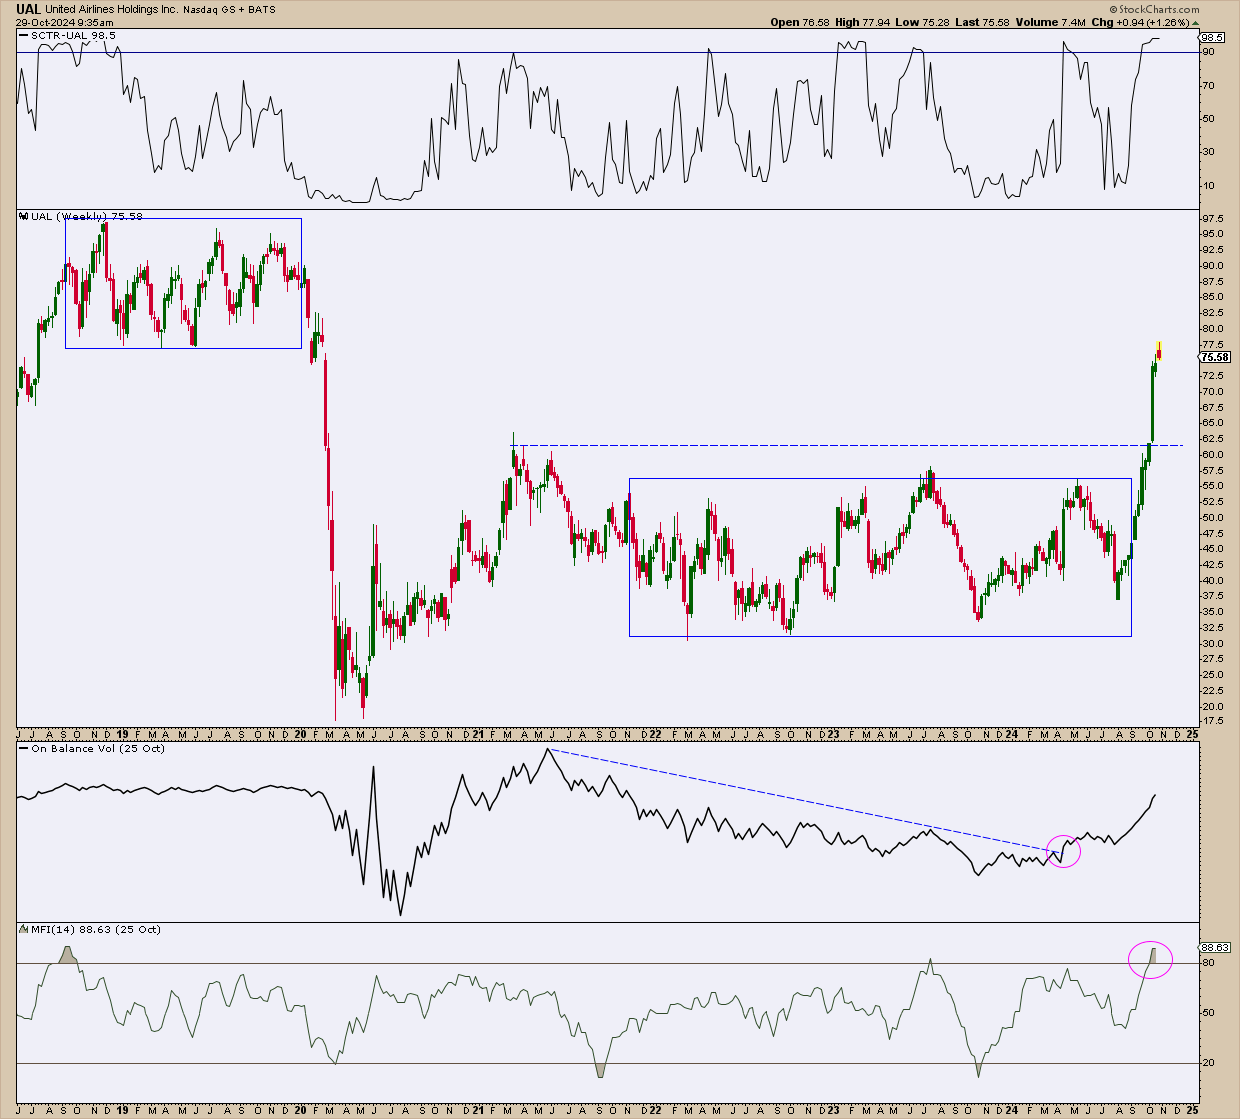
FIGURE 4. WEEKLY CHART OF UNITED AIRLINES STOCK PRICE. UAL stock’s price action is similar to CCL’s, but the OBV has reversed its downward slope and is rising.Chart source: StockCharts.com. For educational purposes.
Like CCL in the previous example, UAL’s technical strength, as measured by the SCTR line, also rises above the extremely bullish 90 line, but seems to never sustain that level for too long. However, in contrast to CCL, the buying pressure driving UAL’s valuations, as measured by the OBV, reversed its downward slope and is now rising. Watch out for the Money Flow Index (MFI), which is flashing an overbought signal, indicating a near-term pullback.
Now look at Delta Airlines (DAL), the middle performer on the PerfCharts comparison. Below is the weekly chart.

FIGURE 5. WEEKLY CHART OF DELTA STOCK. The price chart displays deep swing highs and lows in contrast to CCL and UAL.Chart source: StockCharts.com. For educational purposes.
The approach to DAL will be slightly different, primarily because the stock’s main patterns are driven by swings that are much deeper and more pronounced than those in the other examples.
Note the SCTR line; as price claws its way higher, its overall technical strength, as measured by multiple indicators across several timeframes, failed to reach previous levels above the 90 line. In addition, look at the panels below the chart—the OBV and MFI readings, which both exhibit a bearish divergence in buying pressure. This signals dwindling momentum as DAL’s price establishes a three-year high.
Looking at the chart, note the ZigZag line. This marks the swing high and swing levels that must hold for the current uptrend to remain intact: while DAL broke above the swing high of $54, signaling a continuation of the uptrend, it must also stay above the swing low of $37 for the uptrend to remain intact.
To that end, I drew a Quadrant Line to measure the strength of the potential upcoming pullback, as suggested by the momentum indicators. For the bulls, a DAL pullback should stay above the last quadrant (above $41) for DAL’s technical strength to remain convincingly bullish.
Add these charts to your ChartLists and monitor their movements in the coming weeks.
Summary in a Nutshell
Each stock presents a longer-term play.
Carnival Corp (CCL)
- Opportunity: Broke out of a bullish ascending triangle pattern, hinting at potential upside.
- Risk: Multiple resistance levels ahead; narrowing momentum signals indecision, with heavy selling likely near $31.
United Airlines (UAL)
- Opportunity: Strong recent performance, with rising buying pressure and outperformance compared to peers.
- Risk: Overbought Money Flow Index (MFI) suggests a near-term pullback might be imminent.
Delta Airlines (DAL)
- Opportunity: Currently in an uptrend, breaking past key swing levels.
- Risk: Dwindling momentum, with bearish divergences in OBV and MFI. The stock must hold above key levels ($41) to maintain bullish strength.
At the Close
You will have to decide for yourself which among the three might be the stronger stock to invest in when the time comes. Again, these are longer-term plays, but if played well, they may present strong investment opportunities. Keep an eye on momentum and key price patterns that could shift.
Bottom line: Add them to your ChartLists and be ready for the next opportunity.

Disclaimer: This blog is for educational purposes only and should not be construed as financial advice. The ideas and strategies should never be used without first assessing your own personal and financial situation, or without consulting a financial professional.


